Feature Purpose:
Provides registration analytics
Working with this Feature:
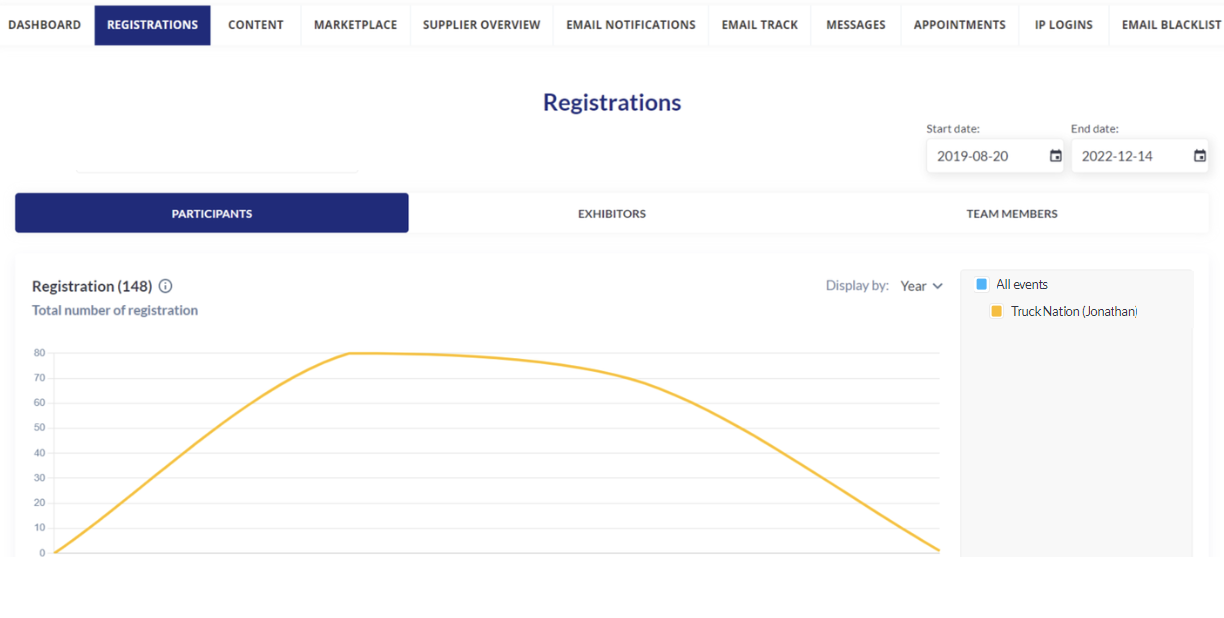
To access General Analytics, navigate to the Analytics module and select "General."
Upon opening General Analytics, you will find several tabs within this section.
The Registrations tab consists of 3 subtabs – Exhibitors, Team Members and Participants
-
Please note that Team Members are not included on the Participants subtab
In addition to the registrations over time graph, each subtab provides data about participant category registrations, countries which were selected during registration, top interest categories, top activity categories, and cumulative revenue with the ability to filter by year or by quarter for each the events in this same envirinment.
Overview of each block on the Registration Analytics page
|
Exhibitor-Registration |
Shows number of added Exhibitors over time between start and end date (how many were added from all sources in each point of time). Can be chosen to show by day, week, month or year. |
|
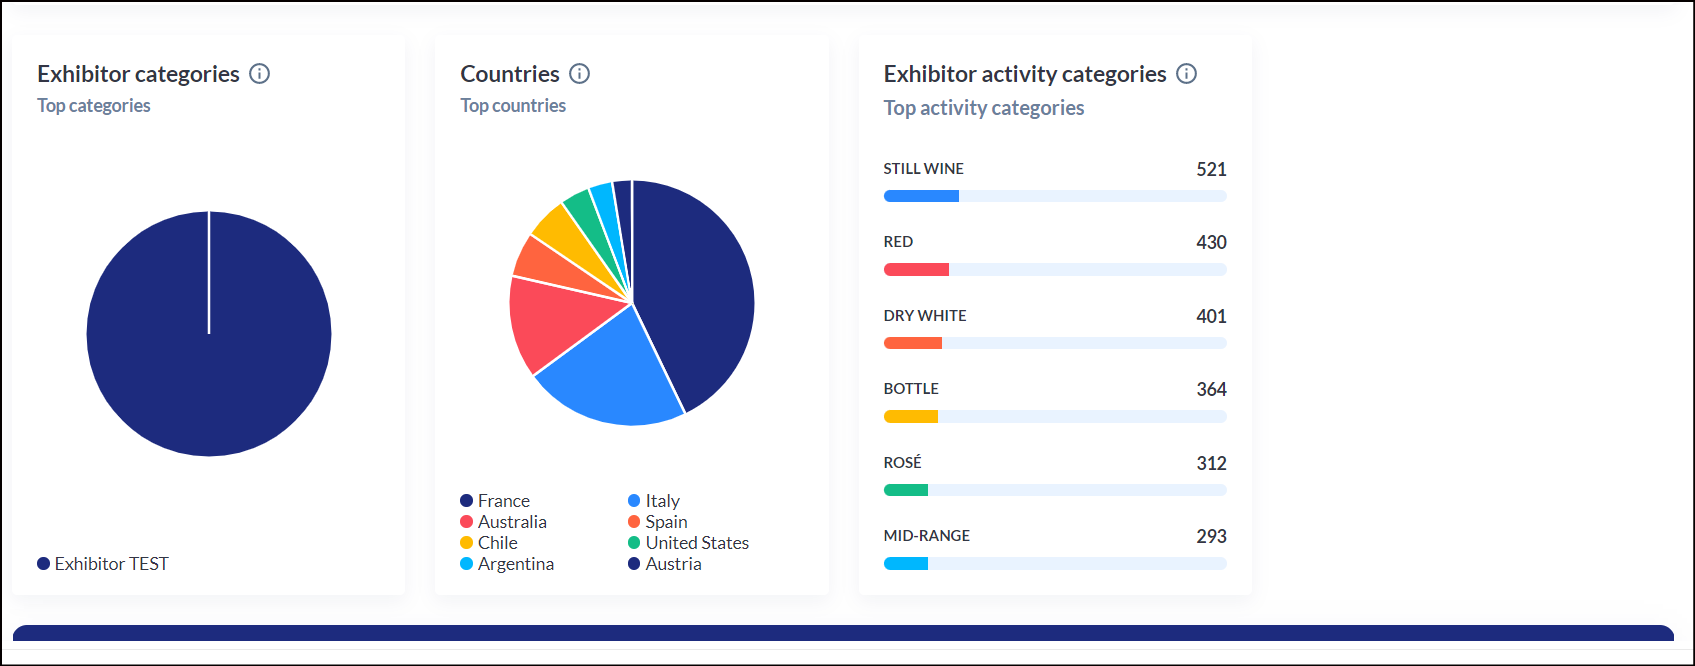
Exhibitor-categories |
Shows division of Exhibitors that appeared between start and end date based on their category |
|
Exhibitor-countries |
Shows division of Exhibitors that appeared between start and end date based on their country |
|
Exhibitor-interest-categories |
Shows top 6 Exhibitor Interest categories present on the end date (no matter the start date) with number of times each category was added as Interest for Exhibitor |
|
Exhibitor-activity-categories |
Shows top 6 Exhibitor Activity categories present on the end date (no matter the start date) with number of times each category was added as Activity for Exhibitor |
|
Participant-registration |
Shows number of added Participants over time between start and end date (how many were added from all sources in each point of time). Can be chosen to show by day, week, month or year. |
|
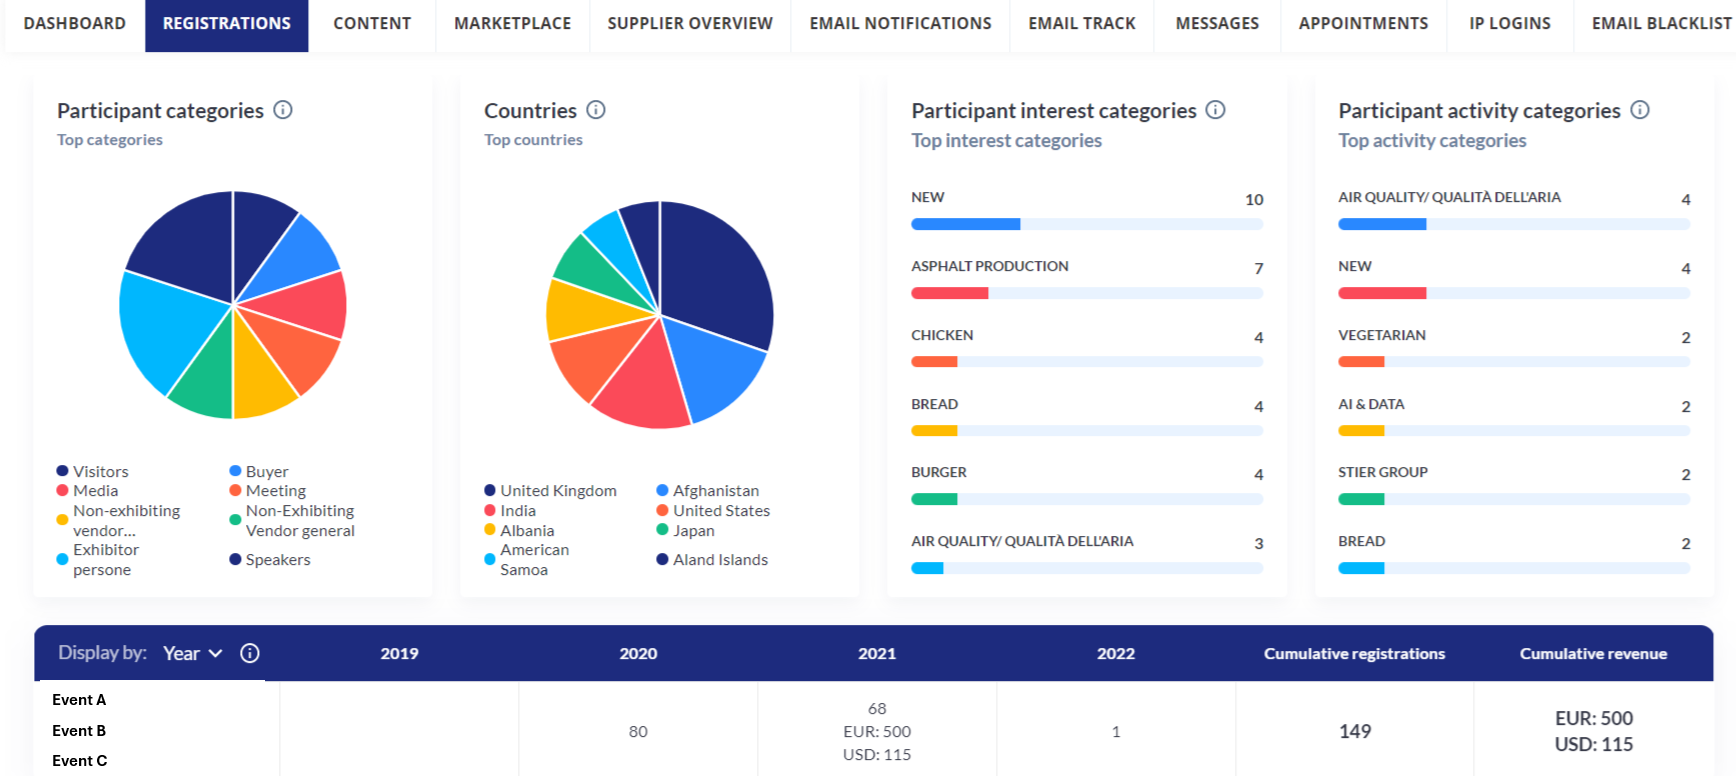
Participant-categories |
Shows division of Participants that appeared between start and end date based on their category |
|
Participant-countries |
Shows division of Participants that appeared between start and end date based on their country |
|
Participants-interest-categories |
Shows top 6 Participant Interest categories present on the end date (no matter the start date) with number of times each category was added as Interest for Participant |
|
Participants-activity-categories |
Shows top 6 Participant Activity categories present on the end date (no matter the start date) with number of times each category was added as Activity for Participant |
|
Teammember-registration |
Shows number of added Team members over time between start and end date (how many were added from all sources in each point of time). Can be chosen to show by day, week, month or year. |
|
Teammember-categories |
Shows division of Team members that appeared between start and end date based on their category |
|
Teammember-countries |
Shows division of Team members that appeared between start and end date based on their country |
|
Teammembers-interest-categories |
Shows top 6 Team member Interest categories present on the end date (no matter the start date) with number of times each category was added as Interest for Team member |
|
Teammembers-activity-categories |
Shows top 6 Team member Activity categories present on the end date (no matter the start date) with number of times each category was added as Activity for Team member |
|
Table-exhibitor |
Shows number of added Exhibitors and money they spent over time between start and end date (how many were added from all sources in each point of time). Can be chosen to show by day, week, month or year. |
|
Table-participant |
Shows number of added Participants and money they spent over time between start and end date (how many were added from all sources in each point of time). Can be chosen to show by day, week, month or year. |
|
Table-teammember |
Shows number of added Team members and money they spent over time between start and end date (how many were added from all sources in each point of time). Can be chosen to show by day, week, month or year. |