Feature Purpose:
Provides general event analytics
Working with this Feature:
To access General Analytics, navigate to the Analytics module and select "General."
Upon opening General Analytics, you will find several tabs within this section.
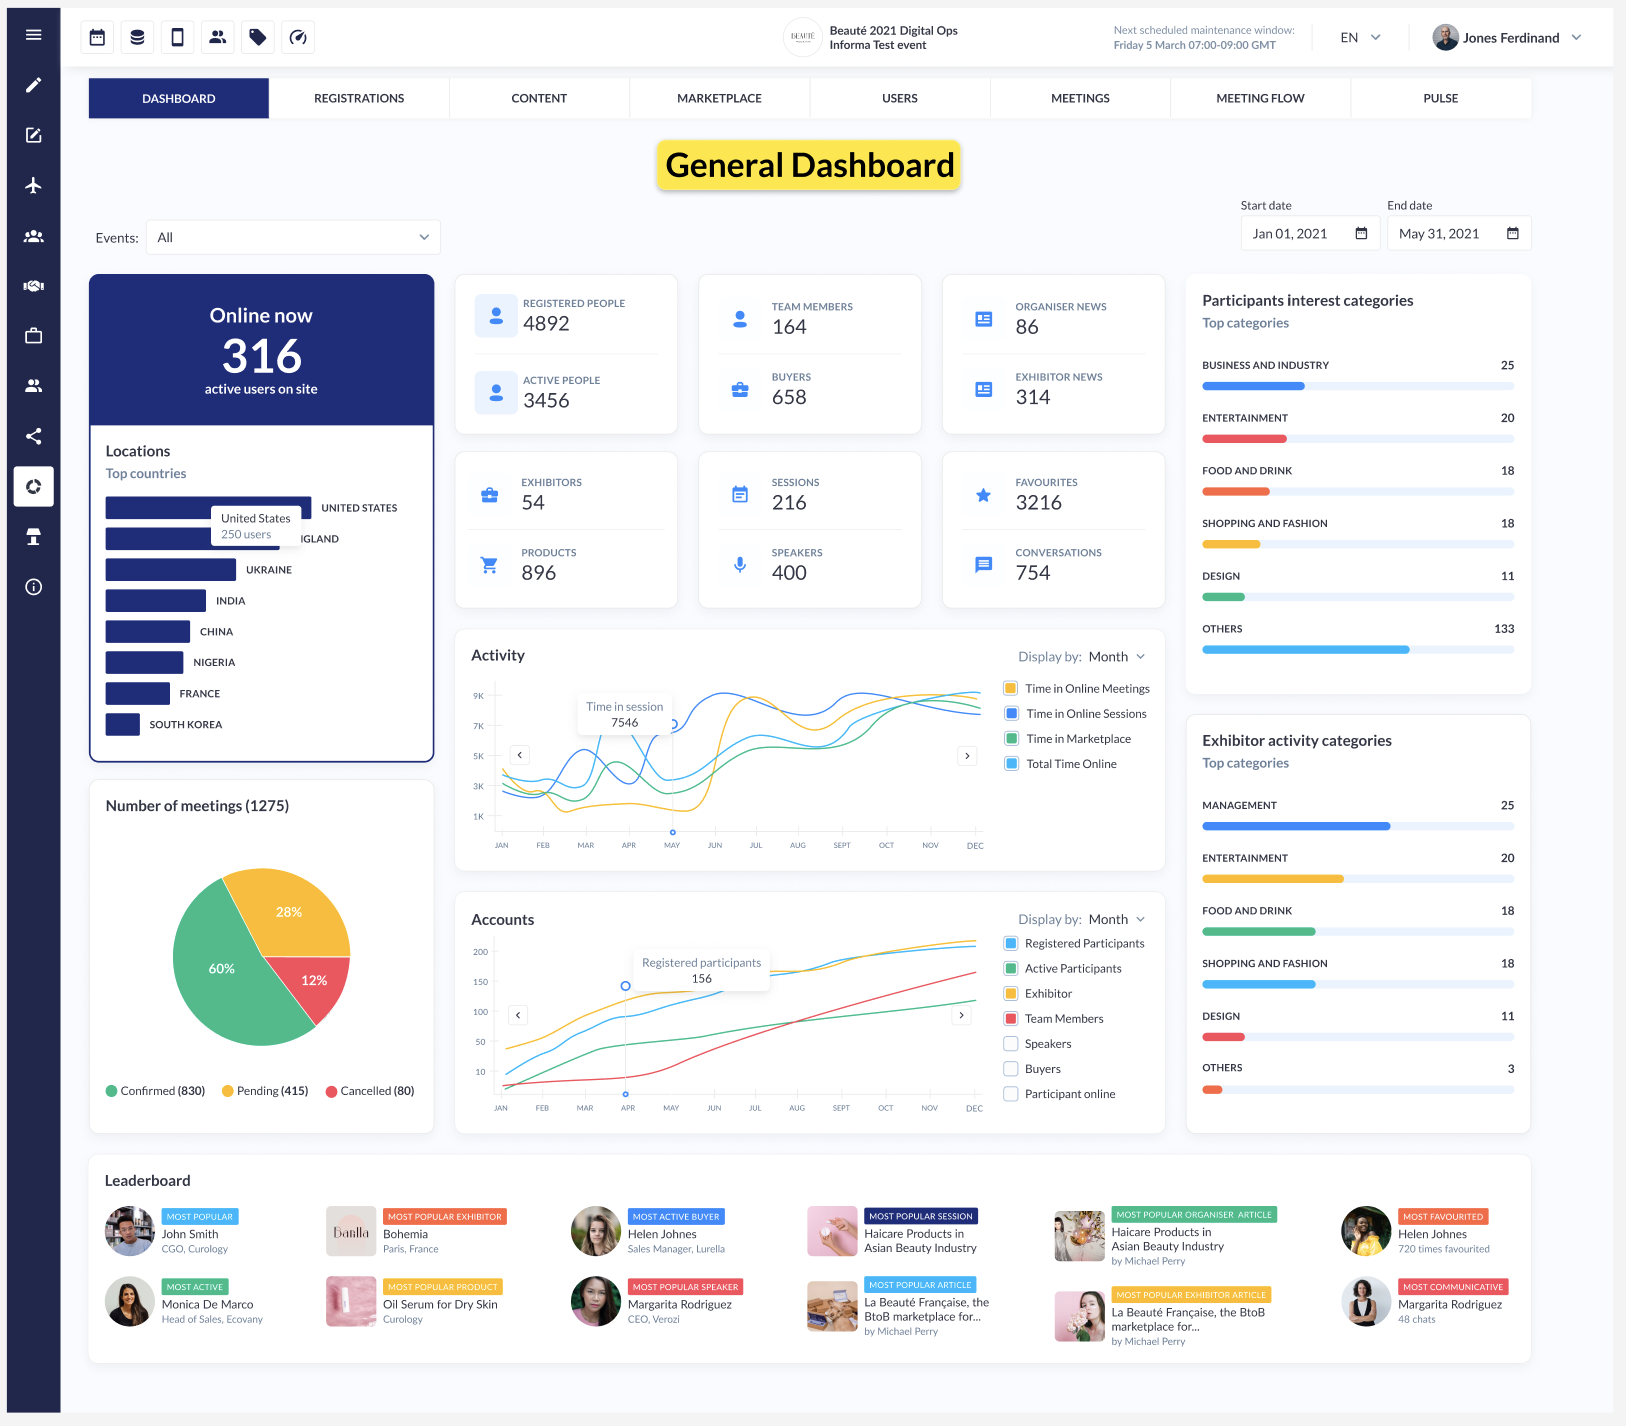
Overview of each block on the General Dashboard
|
Online now |
Shows the number of participants for the chosen event who are currently online, along with the top 8 user countries. |
|
Registered people |
Shows the total number of Participant accounts, in all statuses, as of today. |
|
Active people |
Shows the total number of Participant accounts that are in Active status as of today. |
|
Team member |
Shows the total number of Team Member accounts, in all statuses, as of today. |
|
Buyers |
Shows the total number of all Buyer accounts, in all statuses, as of today. |
|
Organizer news |
Shows the total number of Organizer News items as of today. |
|
Exhibitor news |
Shows the total number of Exhibitor News items as of today. |
|
Exhibitors |
Shows the total number of approved Exhibitors as of today. |
|
Products |
Shows the total number of Products as of today. |
|
Sessions |
Shows the total number of Sessions as of today. |
|
Speakers |
Shows the total number of Speaker accounts, in all statuses, as of today. |
|
Favourites |
Shows the total number of Favourite actions as of today. |
|
Conversations |
Shows the total number of chats initiated as of today. |
|
Participant interest categories |
Shows the top 6 Participant Interest Categories as of today, along with the number of times each category was added as a Participant Interest. |
|
Exhibitor activity categories |
Shows the top 6 Exhibitor Activity Categories as of today, along with the number of times each category was added as an Exhibitor Activity. |
|
Activity |
The graph illustrates the trend over time for several metrics: Cumulative Duration in Online Meetings (virtual rooms), Cumulative Duration in Online Sessions (virtual rooms), Cumulative Duration in the Marketplace (viewed by both logged-in and unlogged users on the Marketplace page, including subtabs and public profiles of Exhibitors, Products, Brands, Pavilions, or News), and Cumulative Online Time (for logged-in or unlogged users on the frontend or app). |
|
Number of meetings |
Shows the total number of Confirmed, Pending, and Canceled Meetings as of today. |
|
Leaderboard |
The graph depicts the trend over time, showcasing the most notable users across various aspects of the specified event. It highlights the top participant, the most active participant, the most popular exhibitor, the most popular product, the most active buyer, the most popular speaker, the most popular session, the most popular on-demand session, the most popular organizer article, the most popular exhibitor article, the most favorited (having more favorites than any other entity), and the most communicative (having the highest number of chats). |
|
Accounts |
The diagram shows the progression over time of various groups, including Registered Participants, Active Participants, Exhibitors, Team Members, Speakers, and Buyers. |