Feature Purpose:
Provides information related to suppliers (including their team members).
Working with this Feature:
To access General Analytics, navigate to the Analytics module and select "General."
Upon opening General Analytics, you will find several tabs within this section.
Click on the Marketplace tab to access this page.
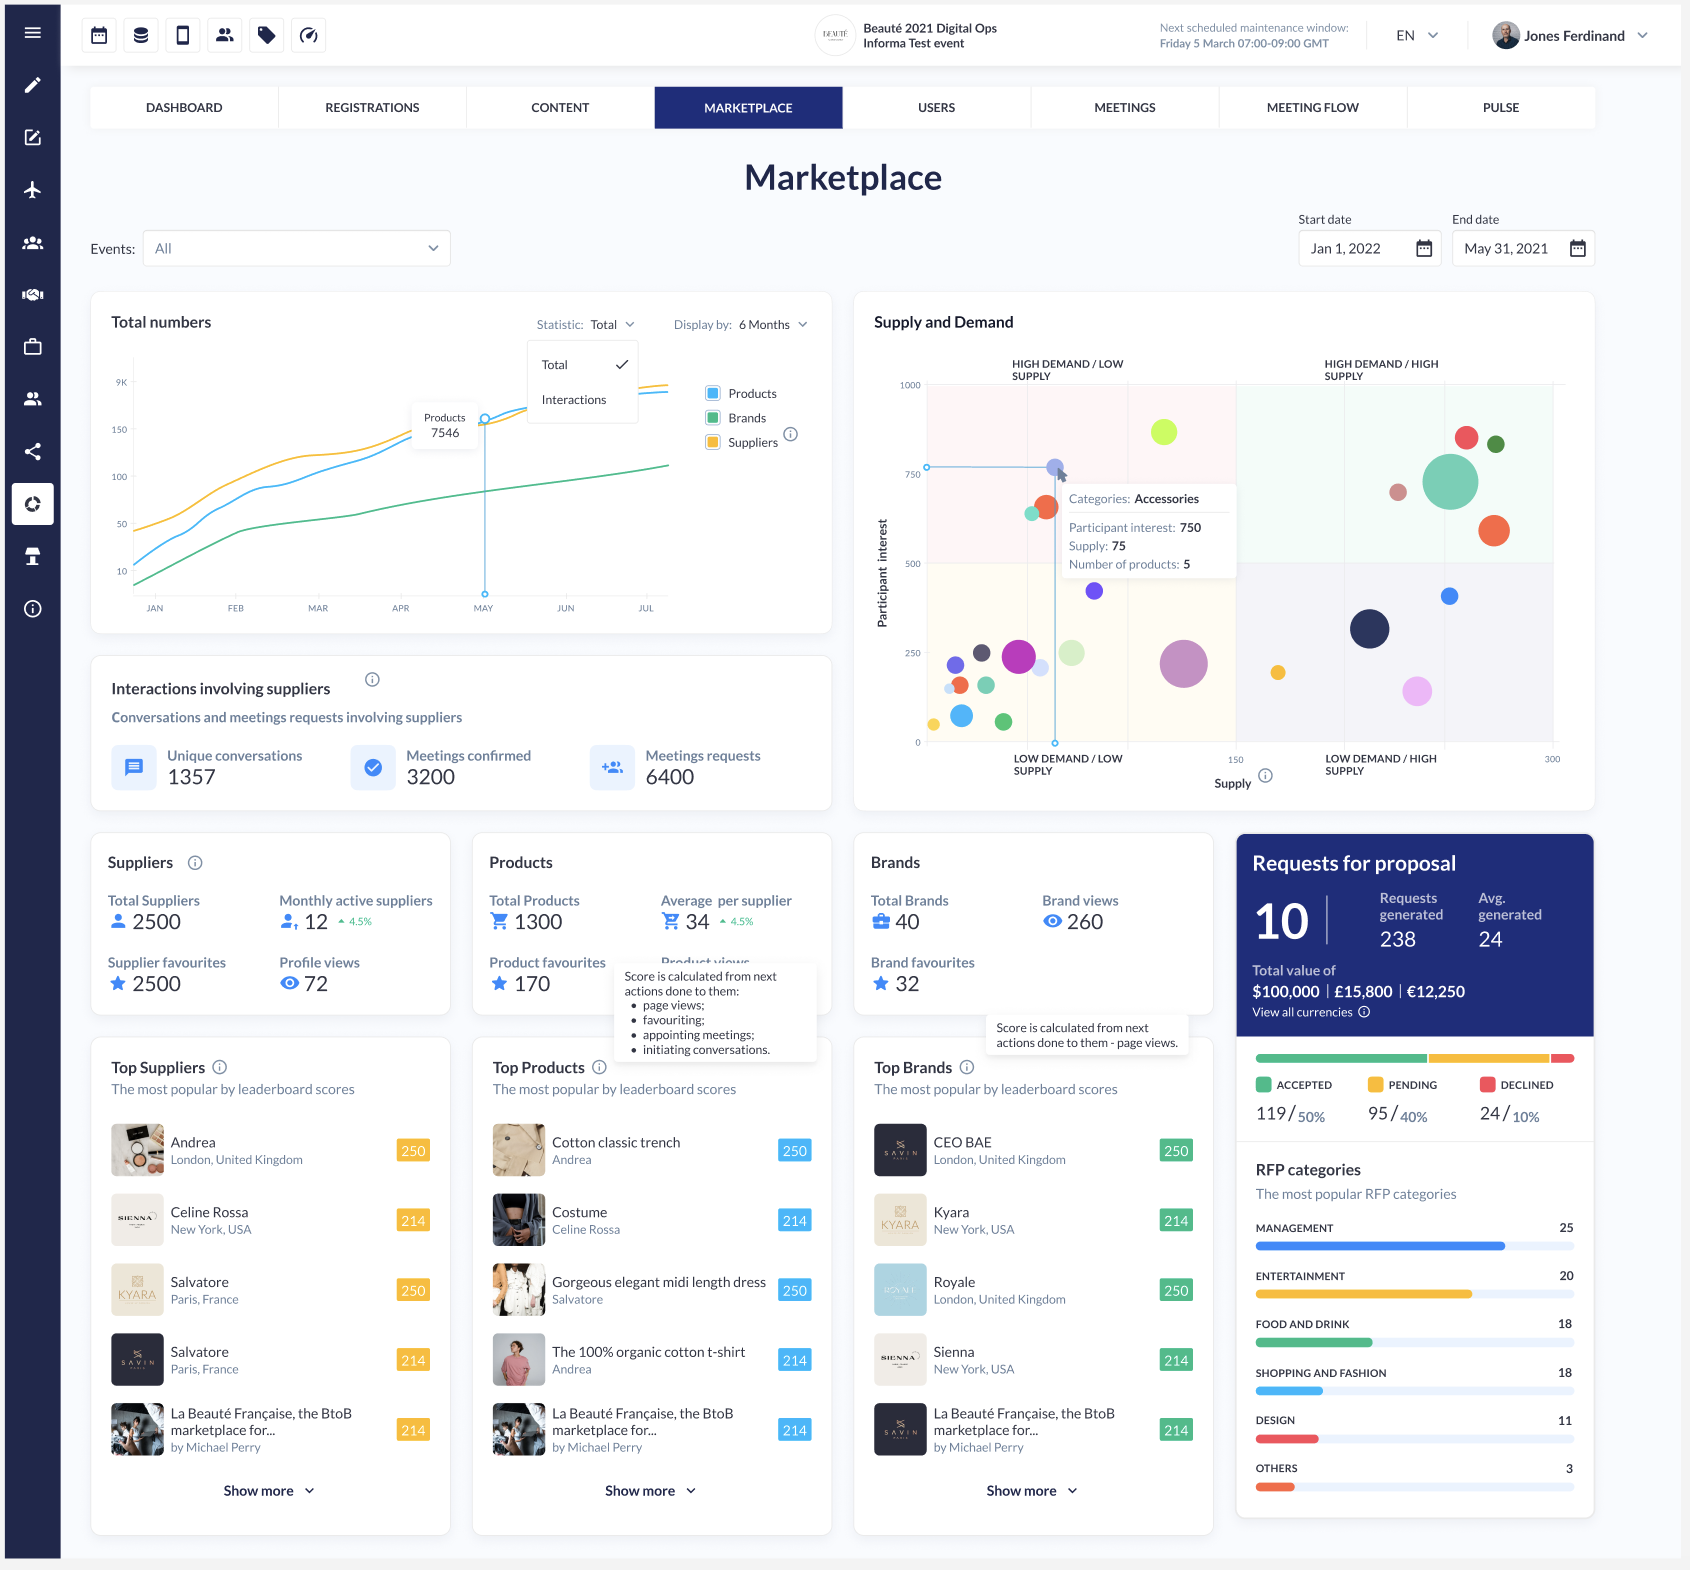
Overview of each block on the Marketplace Analytics page
|
Total numbers |
Displays totals over time, up to today, for Products, Brands, and Suppliers (Exhibitors and their team members). The view can be switched to show Interactions, including Unique Conversations (chats), Meeting Requests and Confirmed Meetings involving Suppliers, with the option to view by day, week, or month. |
|
Interactions involving suppliers |
Shows the total number of Unique Conversations (chats), up to today, initiated or received by Exhibitors or their team members. |
|
Meetings Requests |
Shows the total number of Meeting Requests involving Suppliers (Exhibitors and their team members) up to today. These include only those initiated or received by Exhibitors or their team members. |
|
Meetings Confirmed |
Shows the total number of Meetings Confirmed involving Suppliers (Exhibitors and their team members) up to today. These include only those initiated or received by Exhibitors or their team members. |
|
Total Suppliers |
Shows the total number of Suppliers (Exhibitors with their team members) as of today. |
|
Average per supplier (Active exhibitors)
|
Shows the number of Active Suppliers (Exhibitors with their team members) as of to today. |
|
Supplier favourites
|
Shows the total number of Suppliers (Exhibitors with their team members) who have been favourited up to today. |
|
Profile views |
Shows the total number of Suppliers (Exhibitors with their team members) who have been viewed up to today. |
|
Total products |
Shows the total number of Active products as of today. |
|
Average per supplier (Active products) |
Shows the average number of Active products per Exhibitor as of today. |
|
Product Favourites
|
Shows the total number of Products that have been favourited up to today. |
|
Product Views |
Shows the total number of Products that have been viewed up to today. |
|
Total Brands |
Shows the total number of Brands as of today. |
|
Brands favourites |
Shows the total number of Brands that have been favourited up to today. |
|
Brands views |
Shows the total number of Brands that have been viewed up to today. |
|
Requests for proposal |
Shows number of request (unique), number of requests generated (total number of sent), Avg. generated (number of sent request per 1 unique request), Total value of unique requests, number an percentage of Accepted, Pending and Declined requests |
|
RFP categories |
Shows top 6 categories with number of times each category was used for RFP |
|
Supply and Demand |
Points (bubbles) on it are Product categories based by Participant Interest (excluding team members, Y axis) and Supply (Activity/Product categories of exhibitors/suppliers including team members, X axis). Bubble size is based on number of active products with this category. |