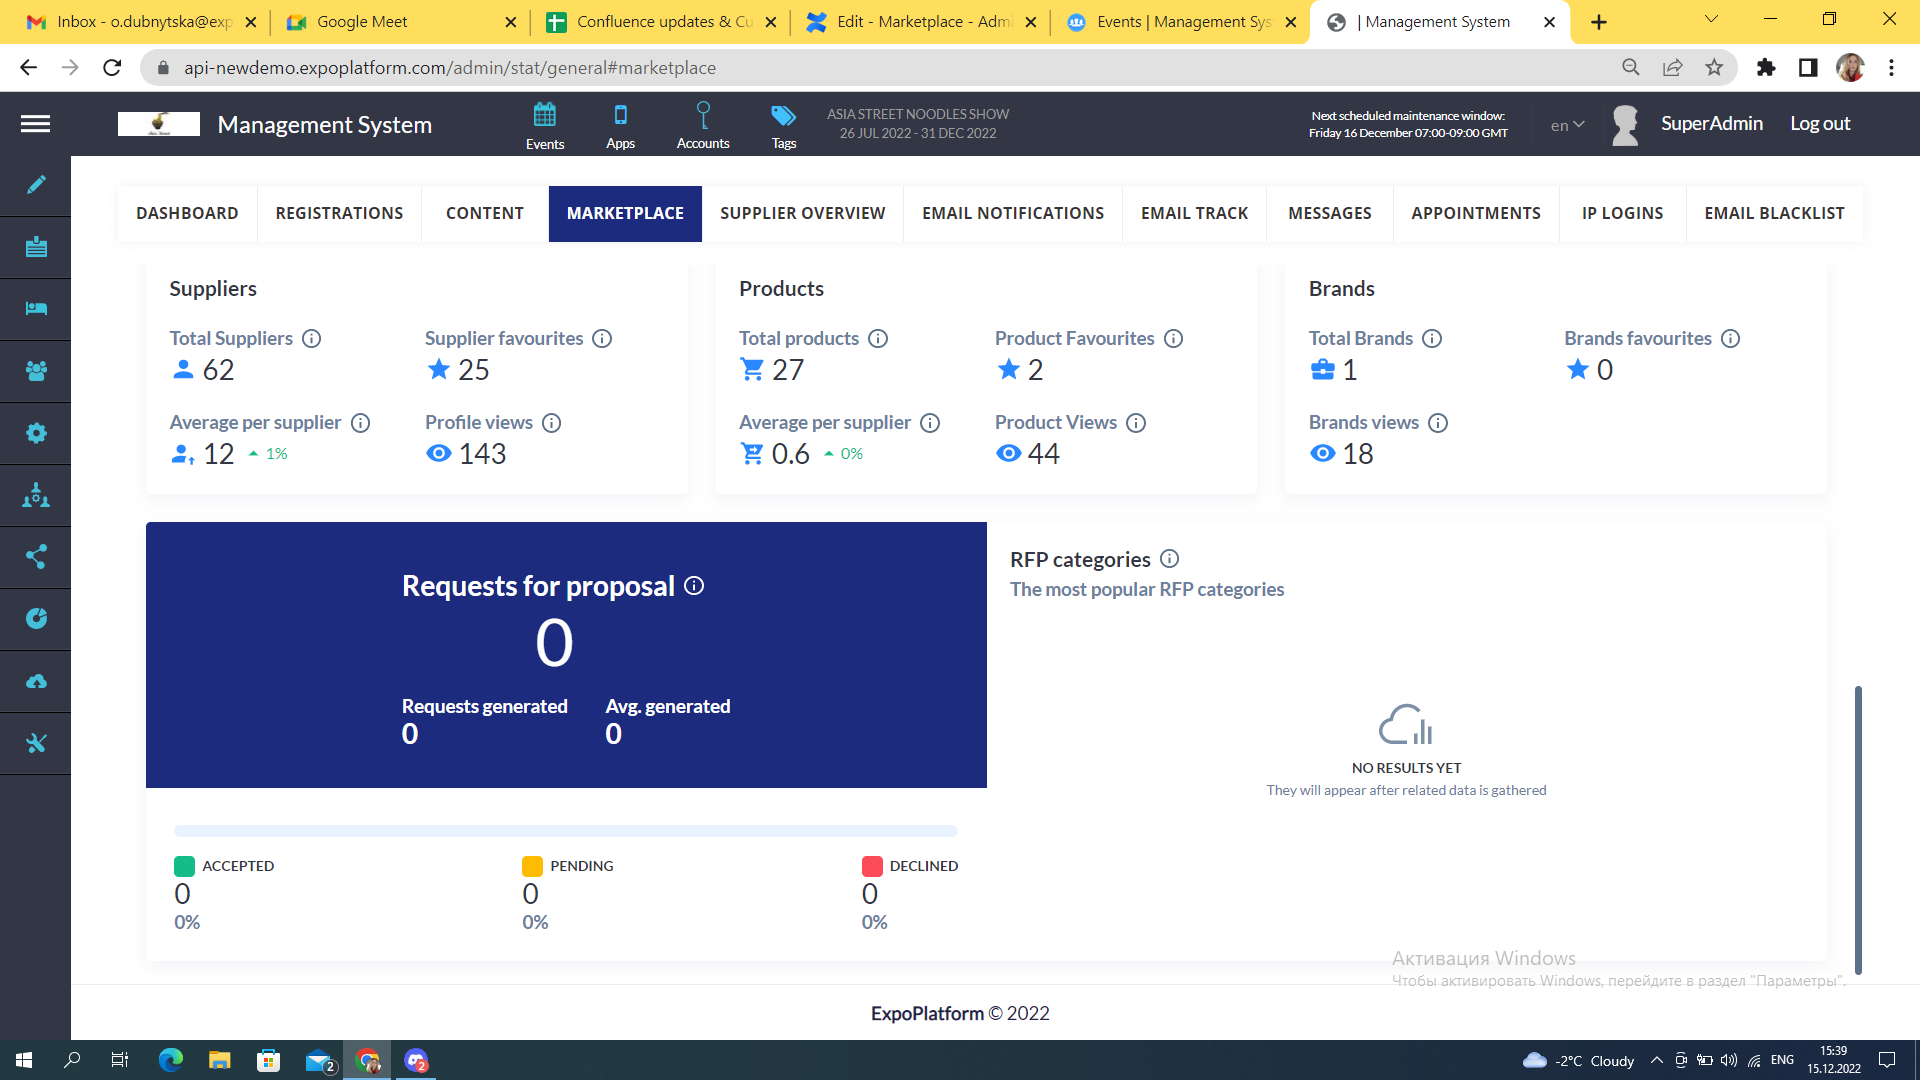
Marketplace
Shows the data of interactions for users in general. Could be filtered via events in one environment and also end / start dates.
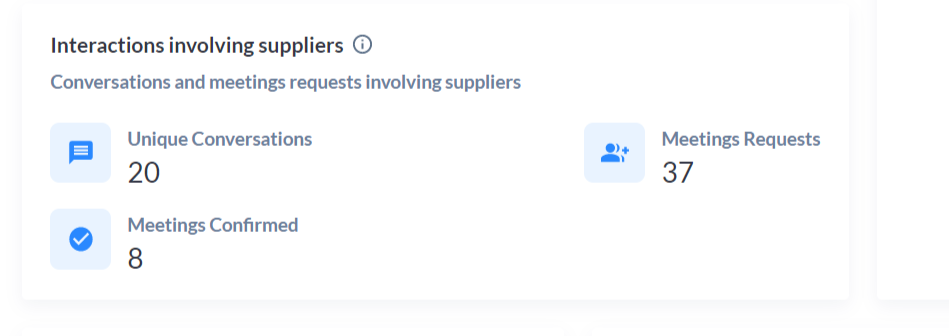
This page provides consolidated data on the total number of Products, Brands, and Suppliers added. The data can be filtered by year or by quarter. The organiser could filter the show Interactions Statistic of Unique Conversations, Meetings Requests and Meetings Confirmed.
In the Supply and Demand tab, these bubbles show Product Categories based on the Participant’s Interest and Supply. Bubble size depends on the number of active products in that category.
Marketplace Page
If we scroll down, we have the possibility to find out the total number of Unique Conversations, Meeting Requests, and Meeting Confirmed.
Additionally, we have the capability to determine the total number of interactions for Suppliers, Products, and Brands, such as profile views and product favourites. We can also track the number of RFP requests generated, identify the most popular RFP categories, and see which RFP requests were accepted, are pending, or were declined.