Feature Purpose:
Provides the exhibitor with an overview of who has interacted with their profile and the actions taken so the exhibitor can then interact and follow up with these leads
Working with this Feature:
Dashboard Tabs
The Lead Dashboard is comprised of several tabs, each tailored to specific user interactions:
-
Interactions
-
Visibility: Exhibitors
-
Details: Displays interactions across profiles, including individual company profiles and team members. Selection between company and individual team members is enabled only in this tab.
-
-
Sponsors Pop-Up Interactions
-
Visibility: Sponsors only
-
Details: Displays interactions specifically for sponsors, reflecting data correlated per sponsor.
-
-
Lead Dashboard - Banner Statistics
-
Visibility: Sponsors only
-
Details: Shows sponsor-specific interactions through event banners.
-
-
Exhibitor List Interactions
-
Visibility: Sponsors only
-
Details: Focuses on interactions within the exhibitor list, correlating data per sponsor.
-
-
Product List Interactions
-
Visibility: Sponsors only
-
Details: Tracks interactions related to the product lists, tailored for sponsors.
-
-
Content Scans
-
Visibility: Exhibitors
-
Details: Captures all QR code scans at the event.
-
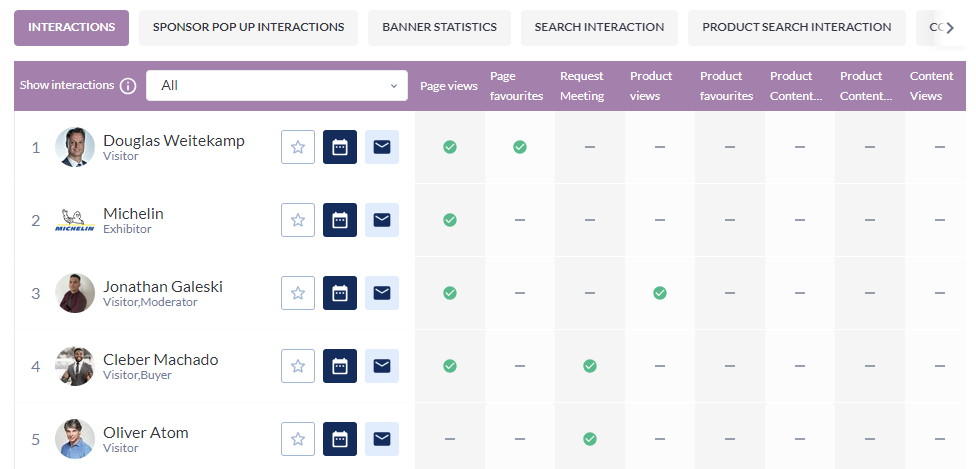
Table Interaction and Display
-
Sorting: No sorting by name across all tables.
-
Horizontal Scroll: Available when columns exceed the page width.
-
Profile Picture Placeholder: Displayed if a participant lacks a profile picture.
-
Total interactions: For each column the number of all interactions done by the users is accumulated and the total number is displayed on the Total fields above the board.
-
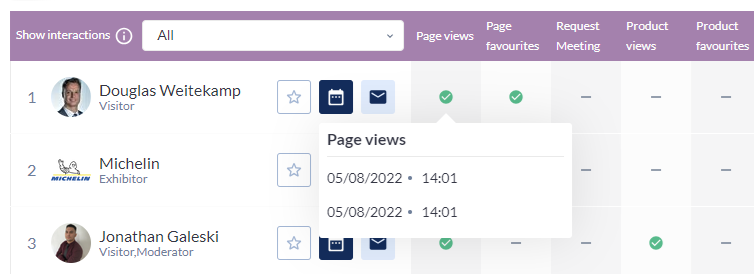
Tooltips. Tooltips should appear every time we hover the number of actions or checkmark.
-
When hovering over a checkmark, the date and time of each of those interaction is shown
-
The general rule for all tables is - the number of cells for each tooltip depends on its size - if one cell takes 2 raws, we can have 5 cells max, if one cell takes 1 raw - we have 10 cells max.
-
Interactions/All
Shows the interaction with the team members and exhibitor's profile. Desired option can be picked in the Show interactions field. The options are:
-
All (Company + team members)
-
Company profile
-
Any of the exhibitor’s team member by first and last name
|
Metric |
Additional info |
|---|---|
|
Profile Views Products views Content views Content Downloads (need to show what content was downloaded the most) |
Shows the rating of the content or profile. Therefore the order is from profile/content with more number of actions to the profile content with the least number of actions. Each cell has the date and time of the last action. For these tooltips the first priority is the frequency of the action and then the date/time. For example, if we have the equal number of views for teammember Andrew Smith and Joana Bruster but Andrew’s profile was viewed later than Joana’s, Andrew will have higher cell in the tooltip. |
|
Profile Favourited Products Favourited |
In most cases the profile can be favorited only once so for this tooltip we have only the name of who was favorited with the date and time of this action. The order is from the latest (on top) to the earliest (on the bottom). If the profile was favourited and then unfavourited the number of favourites is descreased on the table by 1. |
|
Scanned badges |
Should have all the badges scans in the chronological order. If the same team member was scanned twice we need to show it in 2 different cells. Only people can be scanned and not the companies. |
|
Confirmed Meetings |
Shows the ateendees of the meeting (not meeting title) with the date of the meeting confirmation. It can be one ateendee or few of them. The meetings are in the chronological order. If we have 2 meetings with the same team member (where team member is the only attendees), those meetings will be shown in 2 separate cells. |
|
Chats |
It can be chat with the company/team member or group chat with few people (in this case we show the name of the chat). All chats arranged by the date/time the chat was initiated. The name of the chat can be long so you it should be cropped. |
Interactions/Member
Overview
The Interactions/Member tab focuses on detailing interactions specific to a selected team member. Once a member is selected, the dropdown to choose interaction type becomes disabled, highlighting the targeted interaction data for the chosen individual.
Display Rules
-
Interaction Dates: Displays the dates of interactions in chronological order, ensuring a timeline view of the engagement.
-
Interaction Types:
-
Checkmark Indicators: Used for interactions that are typically one-time occurrences:
-
Profile Favourited
-
Scanned Badges
-
Chats
-
-
Numerical Indicators: Used for interactions that can occur multiple times:
-
Profile Views
-
Confirmed Meetings
-
The use of checkmarks and numerical indicators helps in quickly identifying the nature and frequency of interactions.
-
This section of the dashboard provides a clear, structured view of interactions tied to specific team members, making it easier for users to track and analyze individual engagement metrics within the event.
|
Profile Views Scanned badges |
Last 10 actions with the dates of the action. |
|
Profile Favourited |
The action can be done only once that’s why we have only one cell. If the profile was favourited and then unfavourited there is no checkmark in the table. |
|
Confirmed Meetings |
The date that is included is the date of meeting confirmation. If team member was in the group meeting and 1 on 1 meeting we will have 2 meetings between participant and team member on the table |
|
Chats |
Counts only 1 on 1 chats that can be initiated only one time (note: for interactions/all we count also group chats). Shows date and time of chat initialtion. |
Sponsors Pop-Up Interactions
Overview
The Sponsors Pop-Up Interactions tab is exclusively designed for interactions related to sponsors. It captures and displays data that is specifically correlated to each sponsor's engagement through their pop-up interactions.
Functionality
-
Interaction Display: The tab automatically displays actions performed by users within the sponsor pop-up. This feature is activated when a user opens the public profile of an exhibitor who is also a sponsor and engages with the pop-up specifically set up for them.
-
Disabled Features: The 'Show interactions' field is disabled in this context, reflecting the tab's exclusive focus on sponsor-specific interactions.
Actions Counted
The following user actions within the sponsor pop-up are tracked and displayed in this tab:
-
Requesting a Meeting: Initiating a meeting setup with the exhibitor-sponsor.
-
Initiating a Conversation: Starting a dialogue via the pop-up.
-
Favouriting the Profile: Marking the sponsor's profile as a favorite.
-
Closing the Pop-Up: User action of closing the pop-up interface.
Tooltip Details
-
Chronological Order: Information within the tooltips is organized chronologically, providing a time-ordered view of interactions for clearer tracking and analysis.
|
Metric |
Description |
|---|---|
|
Requested Meeting |
Show the time when request a meeting was completed from sponsor popup. |
|
Initiated Conversation |
Shows the date and time when initiate a conversation button was used in sponsor popup and user sent some message. |
|
Favourited Profile |
Shows the date and time when favourite button was used from sponsor popup. Note: it’s not possible on the sponsor pop-up to unfavourite. |
|
Closed pop up |
Shows the date and time when user closed popup without no interactions (meeting, message, favourite) done. |
Banner Statistics Tab
Overview
The Banner Statistics tab is specifically tailored for sponsors to analyze the effectiveness of their advertising banners displayed across various pages and platforms. This tab exclusively shows data correlated to each sponsor's banner interactions.
Display of Interactions
-
Correlated Data: Provides a detailed view of the number of clicks each banner receives, along with an event-wide average for comparative analysis.
-
Banner Locations:
-
Web Pages: Includes Search page (TOP), Search page (Left), Delegates page, Speaker page, Sessions page, News list, Floor plan page (TOP), Floor plan (Left), Article page, Community page, Group page, Feed page.
-
App Sections: Visitor's My Profile, Exhibitor's My Profile, App exhibitor list, App products catalogue, App speakers page, App visitors/buyers page, App sessions page.
-
Table Display Rules
-
Inclusiveness: All banners are included in the table regardless of whether pictures are uploaded for them or not, ensuring comprehensive visibility.
-
Chronological Order: The clicks and interactions are presented chronologically, facilitating a time-oriented analysis of banner performance.
Exhibitor and Product List Interaction
Overview
The Exhibitor and Product List Interaction tab is exclusively for sponsors, focusing on monitoring interactions with their representations on the Marketplace. This tab displays data correlated specifically to each sponsor's visibility and engagement within the lists of Exhibitors and Products.
Functionality and Data Display
-
Sponsor Cards: Tracks interactions with sponsor cards displayed in the Exhibitor and Product lists on the Marketplace.
Interaction Dynamics
-
Team Member Association: Often, a team member may be attached to a sponsor’s product. Interactions with these product-associated team members are counted towards the sponsor's interaction statistics.
|
Metric |
Additional info |
|---|---|
|
Requested Meeting |
Show the time of when the meeting was requested from Sponsor card. |
|
Initiated Conversation |
Shows the time when chat was initiated from Sponsor cards and a message sent. |
|
Favourited Profile |
Shows the time when profile was favourited from Sponsor card. Once unfavourited, we have -1 in this stats. |
|
Profile views |
Shows time when profile was viewed from Sponsor card. |
QR Scans Tab
Overview
The QR Scans tab provides a detailed analysis of QR code scans across different categories, specifically targeting Exhibitor, Product, and Content scans. This tab offers a comprehensive look at the engagement levels through QR code interactions.
Data Display and Organization
-
Company Scans: Displays the number of QR scans related to the company, with results organized chronologically showcasing the last 10 company scans.
-
Product and Content Scans:
-
Data Organization: Follows the logic similar to profile views in the interactions dashboard.
-
Priority: First prioritizes by the number of actions (scans) and then by the date of the last action.
-
Updated Lead Contribution Logic for Meeting Appointments (May 2026)
The logic for how leads are attributed in the Download Leads file has been updated for meeting appointments that involve exhibitor team members.
New behavior:
-
Meeting appointed to Exhibitor with team members: Each participating team member contributes a lead; the Exhibitor itself does not
-
Meeting appointed to Exhibitor without team members: Exhibitor contributes the lead (unchanged)
Rules that remain unchanged
-
First-action rule: Only the first qualifying action from a given user generates a lead for a given contributor. Subsequent interactions with the same contributor do not create additional leads.
-
Direct team-member meetings: Meetings scheduled directly with a named team member (not the Exhibitor entity) continue to generate a lead for that team member as before.
-
Multiple team members in one meeting: If multiple team members participate in the same meeting, each contributes a separate lead.
Edge case: user meets a team member twice
If a user first appoints a meeting directly to a team member, and then separately appoints a meeting to the Exhibitor in which that same team member is also included, the team member contributes exactly one lead — from the first meeting only. No duplicate lead is generated from the second meeting, in either the Exhibitor's or the team member's Download Leads file.
Retroactive effect on existing data
This change applies to all clients and to both new and existing records. If an Exhibitor regenerates their Download Leads file after the May 2026 release, previously generated leads will be recalculated under the new logic. Clients who previously saw duplicate entries may notice a reduction in their total lead count.