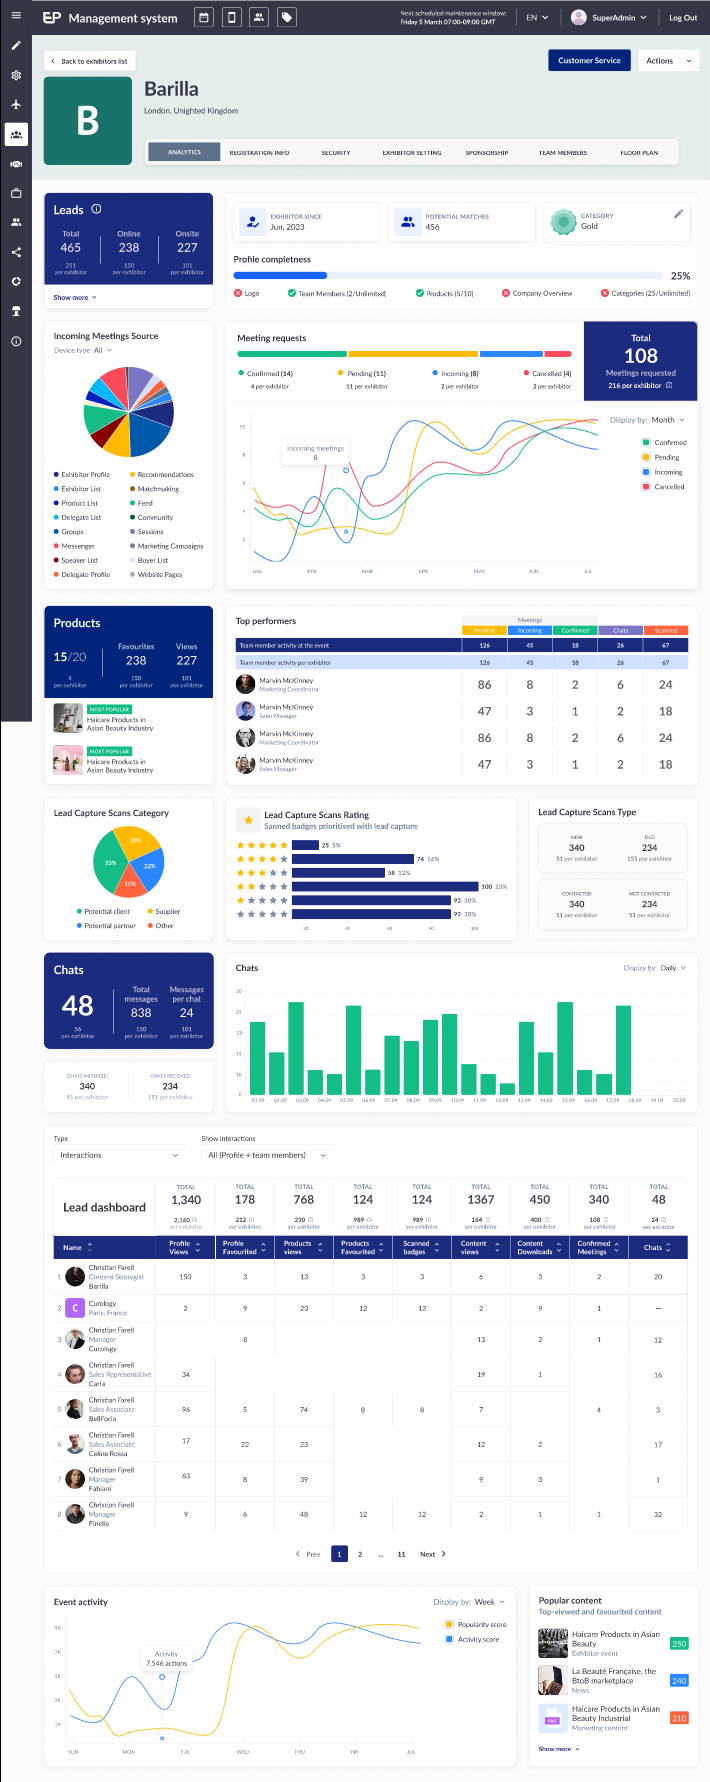
Feature Purpose:
Provides the organizer with various statistics about each exhibitor. These are found under the exhibitor profile on the back end.
Working with this feature:
Below is a list of all the analytics in the form of graphs and widgets available to the organizer under the exhibitor profile on the back end.
Overview of Graphs
-
Data Period Display: For each exhibitor, graphs will only display data from two years prior to the event up to the present date.
-
Continuous Months Display: All months within the specified period will be shown on the graph, even if there is no activity during some of those months, to ensure a seamless timeline.
-
Horizontal Scroll: If the data range is too large to fit within the standard view, graphs will feature horizontal scrolling to enable users to access all the data without any scaling problems.
-
Deduction of Unfavorites: In graphs showing 'favorites,' any instance where an exhibit is unfavorited will result in a decrease in the displayed favorite count, ensuring the statistics reflect current user preferences accurately.
-
Active Exhibitors Only: Average metrics for graphs are calculated using only data from active exhibitors. Statistics for any exhibitors who are deleted or deactivated will not be included in these calculations.
-
Exclusion of Deleted Exhibitors: Only data from active and participating exhibitors will be included to ensure the accuracy and relevance of the analytics.
-
Deletion of Objects: If any related item, such as a chat or product, is deleted, all associated statistical data will also be removed to prevent distortion of the analytics and to maintain the integrity of engagement and activity data.
|
Full Page |
Empty States |
|---|---|
|
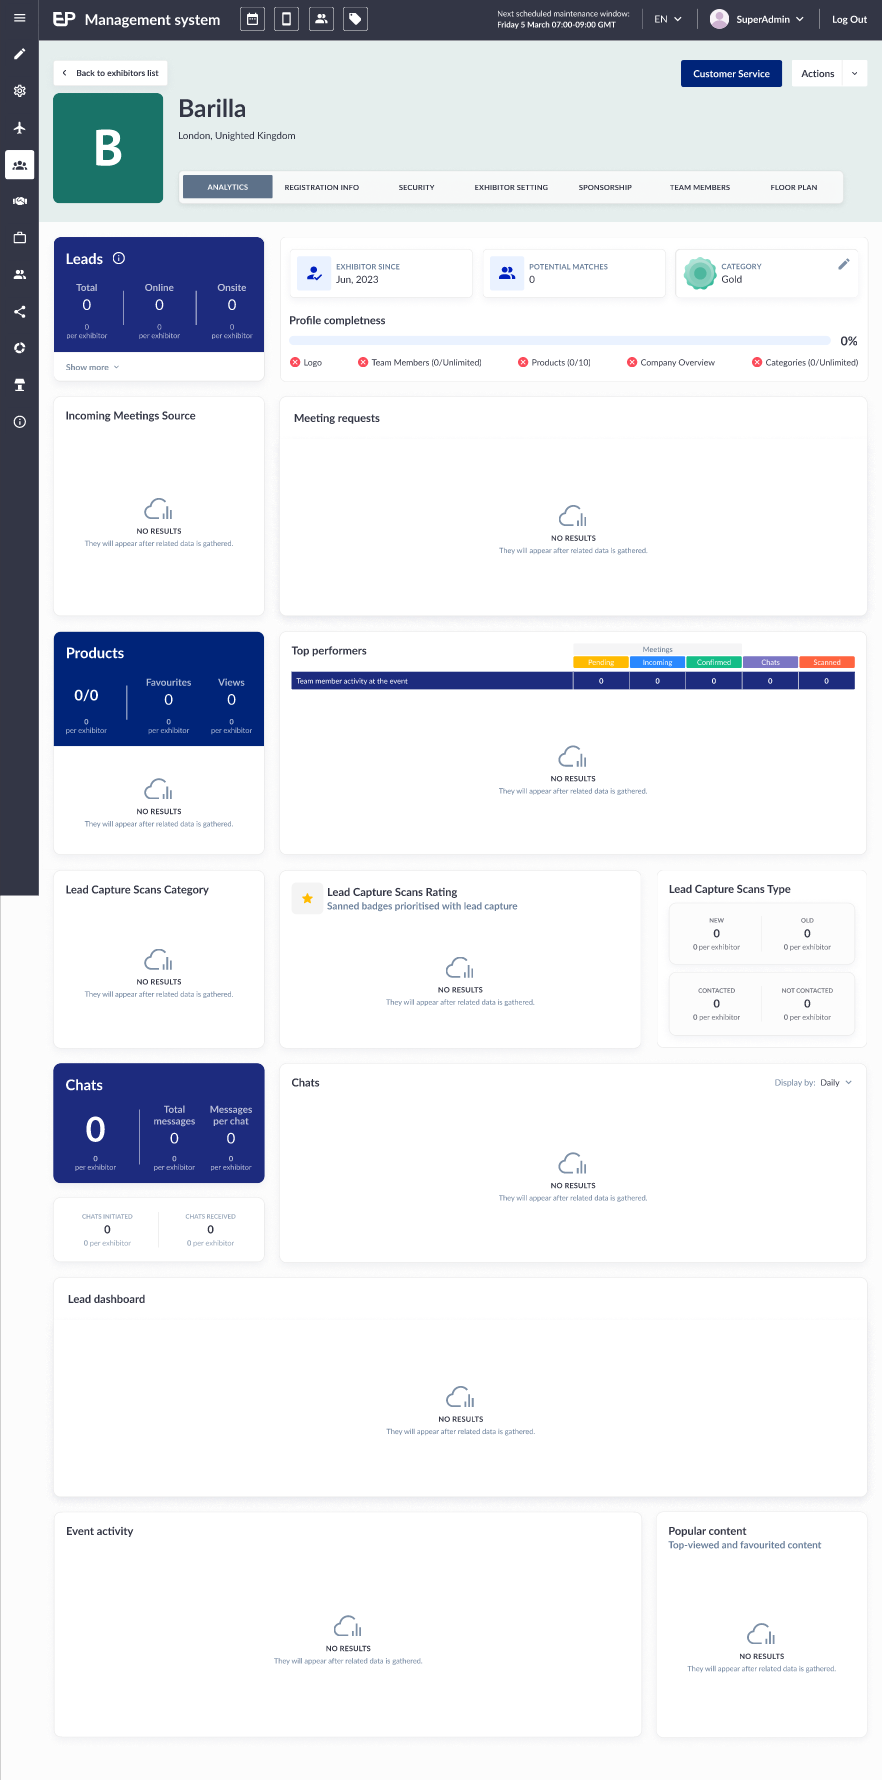
|
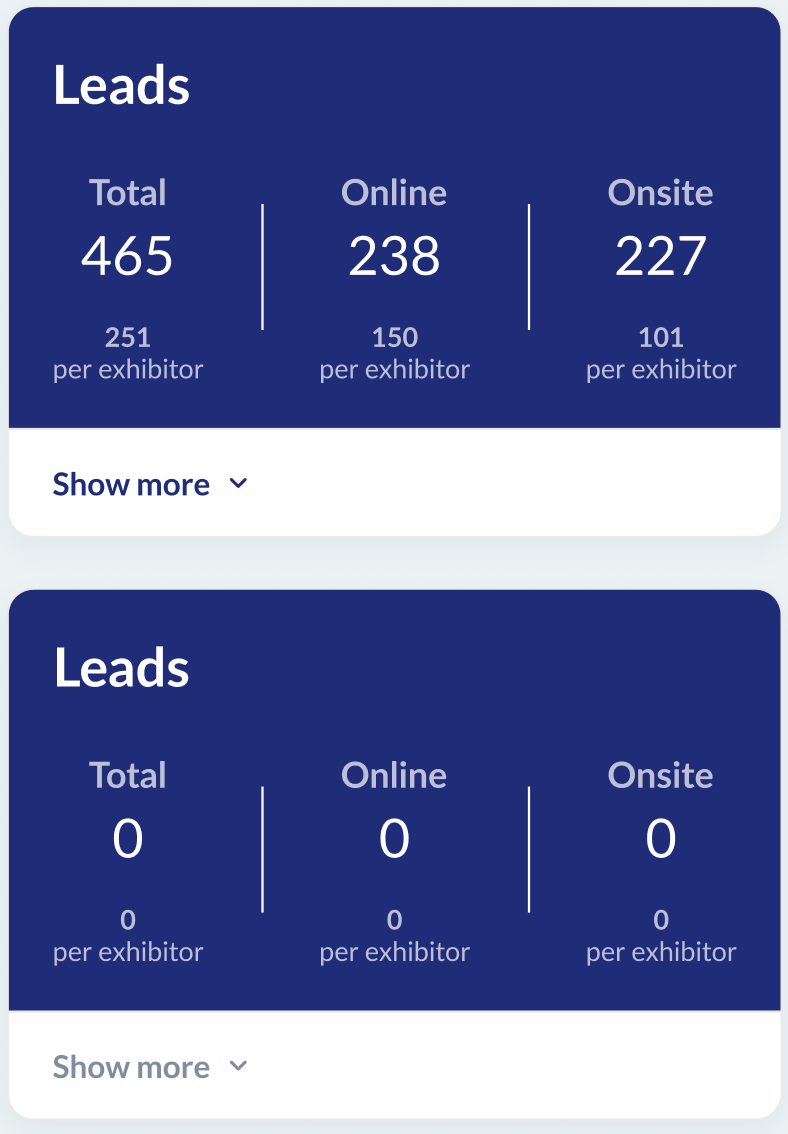
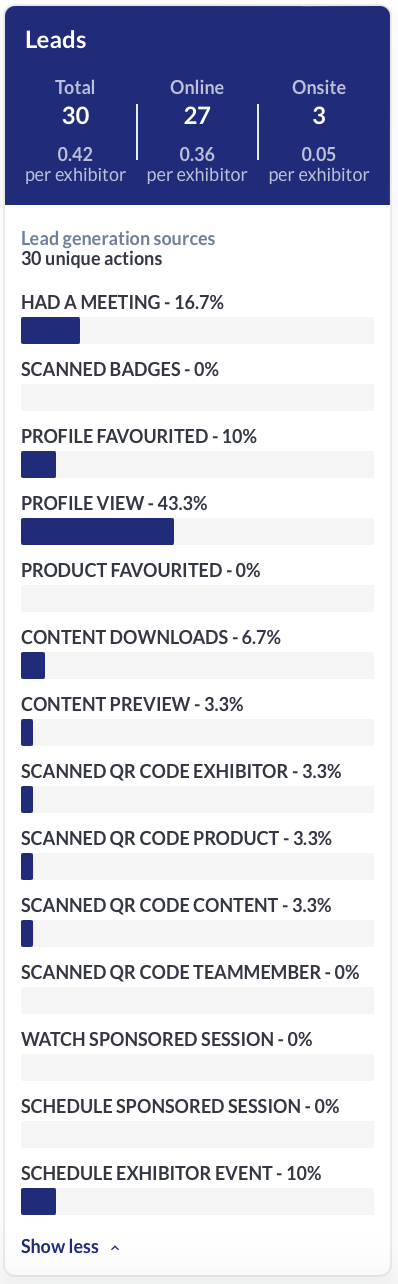
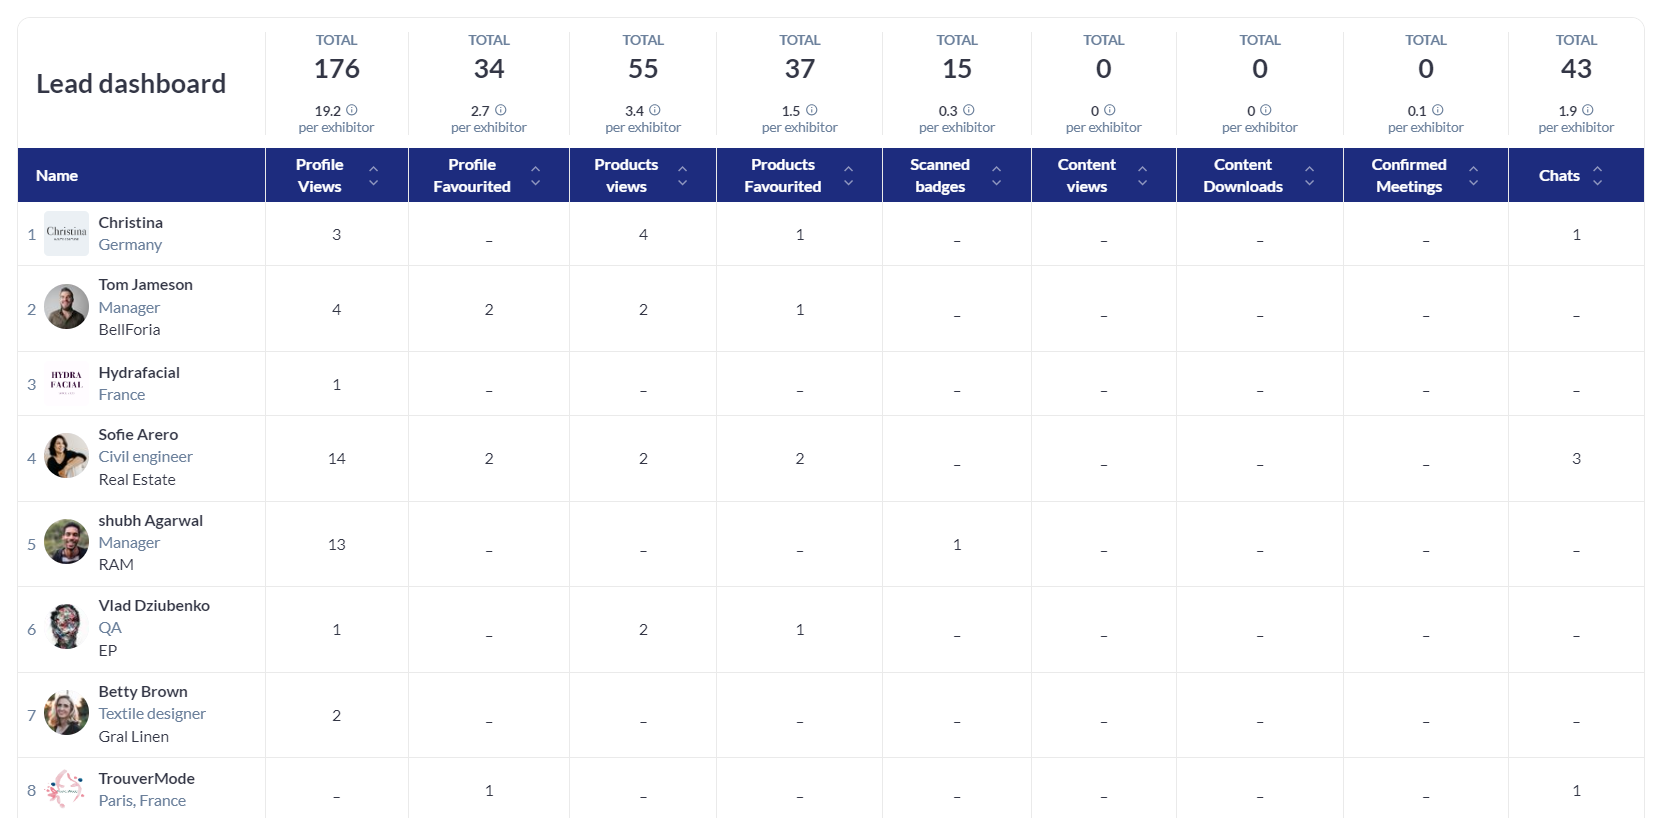
Leads widget
Overview: Provides a detailed summary of leads generated by an exhibitor, distinguishing between "Offline" and "Online" sources.
Leads Section:
-
Total Leads: Displays the overall number of leads acquired by the exhibitor.
-
Offline Leads: Refers to leads collected through physical means at the event, such as badge scans or QR code scans.
-
Online Leads: Refers to leads gathered through digital means, including actions like marking an exhibitor as a favorite, scheduling a meeting, or viewing a profile.
-
Average per Exhibitor: Shows the average number of leads per exhibitor at the event, allowing comparison between the individual exhibitor’s performance and the event average.
Interactive Elements: -
Show More Button: Expands the widget to reveal a detailed breakdown of lead sources in percentages. If there are no leads, the button will appear disabled, and clicking it will have no effect.
-
Hide More Button: Collapses the detailed view back to the summary.
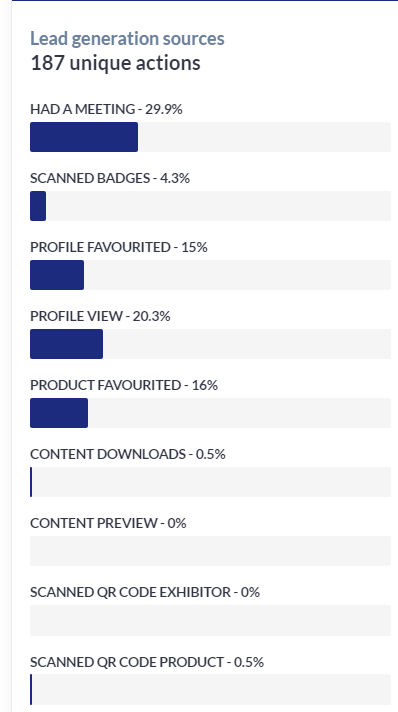
Lead Generation Sources:
Unique Actions: Describes the specific actions that qualify users as leads. Each unique action type is counted only once, regardless of how many times it occurs. For example, if a user favorites, then unfavorites, and favorites an exhibitor’s profile again, it is counted as one favorite.
Lead Count: The total number of leads will always match the number of unique actions recorded.
Source Configuration: Lead sources are defined in the /admin/appointments/shared section under "What Should Count As a Lead?" Even if all options are disabled in this section, the widget and lead sources will still be shown, as badge scan leads are counted by default and cannot be modified.
Data Consistency:
The displayed number of leads, whether total or filtered by source, should align with the figures in the exhibitor's "Download leads file." The graph must be visible even if "Contact Sharing" toggles are off to ensure lead data visibility.
|
|
Profile Statistic
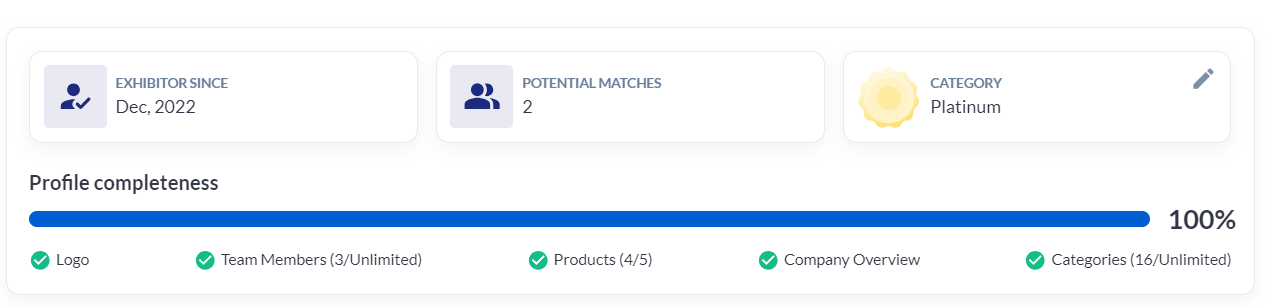
Provides a comprehensive summary of an exhibitor's key details and engagement metrics on the event management platform. Here are the details it encapsulates:
-
Exhibitor since:
-
Shows the date when the exhibitor was first added to the platform for any event. This date is set when an exhibitor is initially created or imported into their first event in the client’s environment.
NOTE: The date will remain unchanged regardless of how often an exhibitor is added to different versions of the event each year. The original date of the exhibitor’s addition will stay the same across all profiles and events.
-
-
Potential Matches:
-
Displays the number of matches found for this exhibitor by the matchmaking algorithm. It includes matches with other exhibitors if "Exhibitor to Exhibitor matchmaking" is enabled.
-
-
Category:
-
Shows the exhibitor’s category with an icon and a color automatically assigned from a predefined set in the design system. The same color is consistently displayed for all exhibitors in that category. An edit button allows quick redirection to the Settings tab to change the category, opening in the same tab to ensure seamless navigation.
-
-
Profile Completeness:
-
Indicates how complete the exhibitor's profile is, following the same visual and functional design as the profile completeness indicator used on the front end of the platform. Shows the following information:
-
Logo: Displays if the exhibitor's logo is uploaded on their profile.
-
Team Members: shows the number of team members associated with the exhibitor along with the allowed number of team members for this exhibitor.
-
Products: displays the count of products associated with the exhibitor along with the maximum number permitted for the exhibitor’s profile.
-
Company Overview: a brief description or overview of the company, which is filled out during registration or edited in the profile tab on the front end.
-
Product Categories: lists the product categories associated with the exhibitor, again limited by the number specified in the exhibitor’s profile settings.
-
-
Incoming Meetings Source Pie Chart
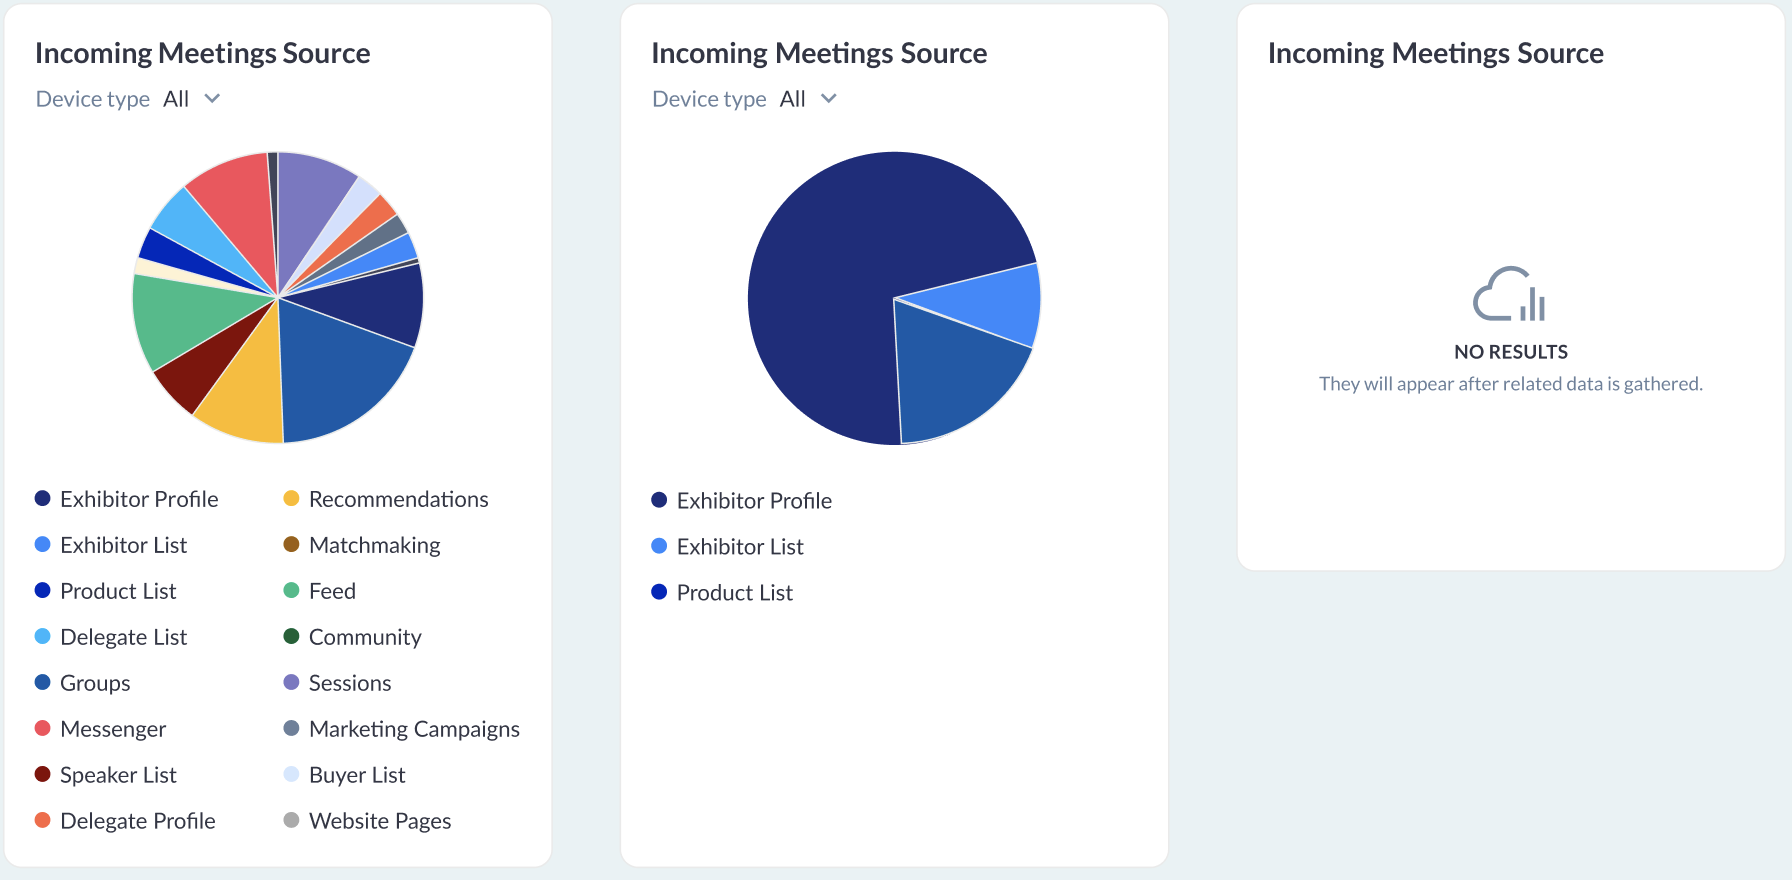
The "Incoming Meetings Pie Chart" is designed to provide detailed insights into the origins of meetings for a specific exhibitor at an event.
Each source is listed along with the number of meetings it has generated. If a particular source has not led to any meetings for the current exhibitor, it will not appear on the list. This approach ensures the widget remains uncluttered and focused on relevant data.
The chart aims to help exhibitors and event organizers understand which interactions or platforms are most effective in generating engagement, enabling them to tailor their approaches and strategies accordingly.
Sorting and Data Interaction:
-
The widget allows users to sort data by "All", "Web platform", or "Mobile app" to segment the analysis as needed.
-
A tooltip appears on hover, providing additional data such as the number of meetings and their percentage relative to the total number of meetings, offering quick and insightful statistical context without needing to navigate away from the page.
Sources of Meetings:
-
Web Sources: Includes Exhibitor List, Exhibitor public profile, Product List, Product public profile, People page (Delegates List, Buyers List, Speaker List), Participant public profile, Groups, Feed (in the profile burger menu), Recommendations, Matchmaking, Community, Website pages (from both new and old website builders), Marketing Campaigns, My Favourites, Dashboard, Notifications, Meeting Wizard.
-
Mobile App Sources: Includes Participant’s profile, Connections page, and Product profile page.
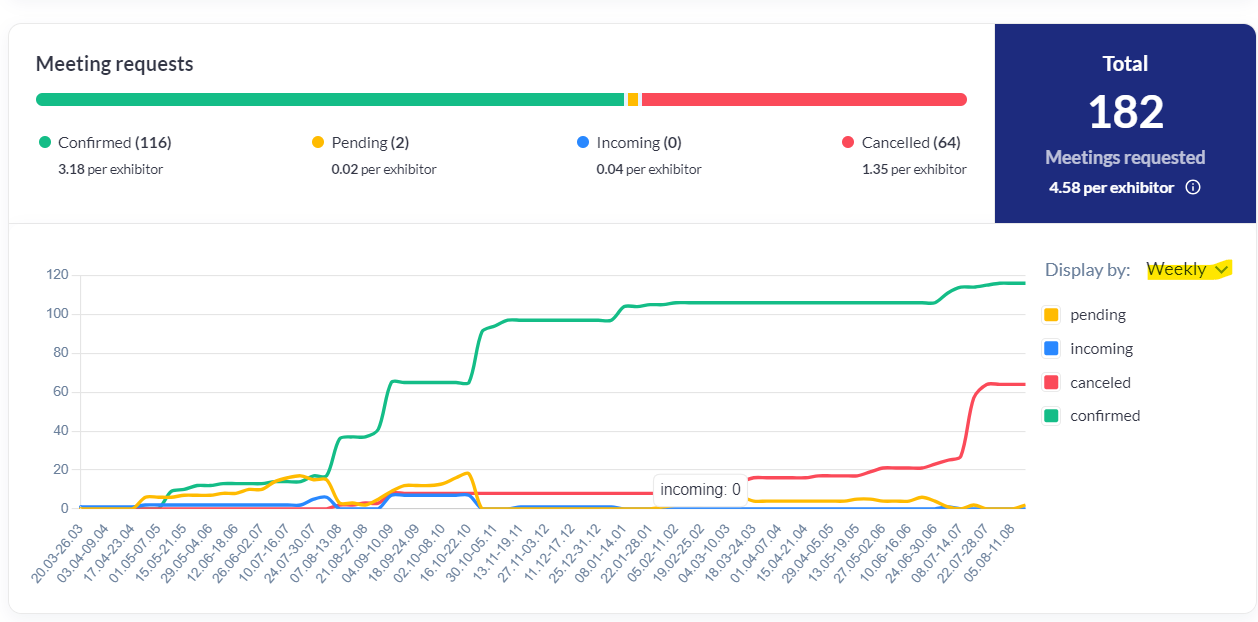
Meeting Requests Line Chart
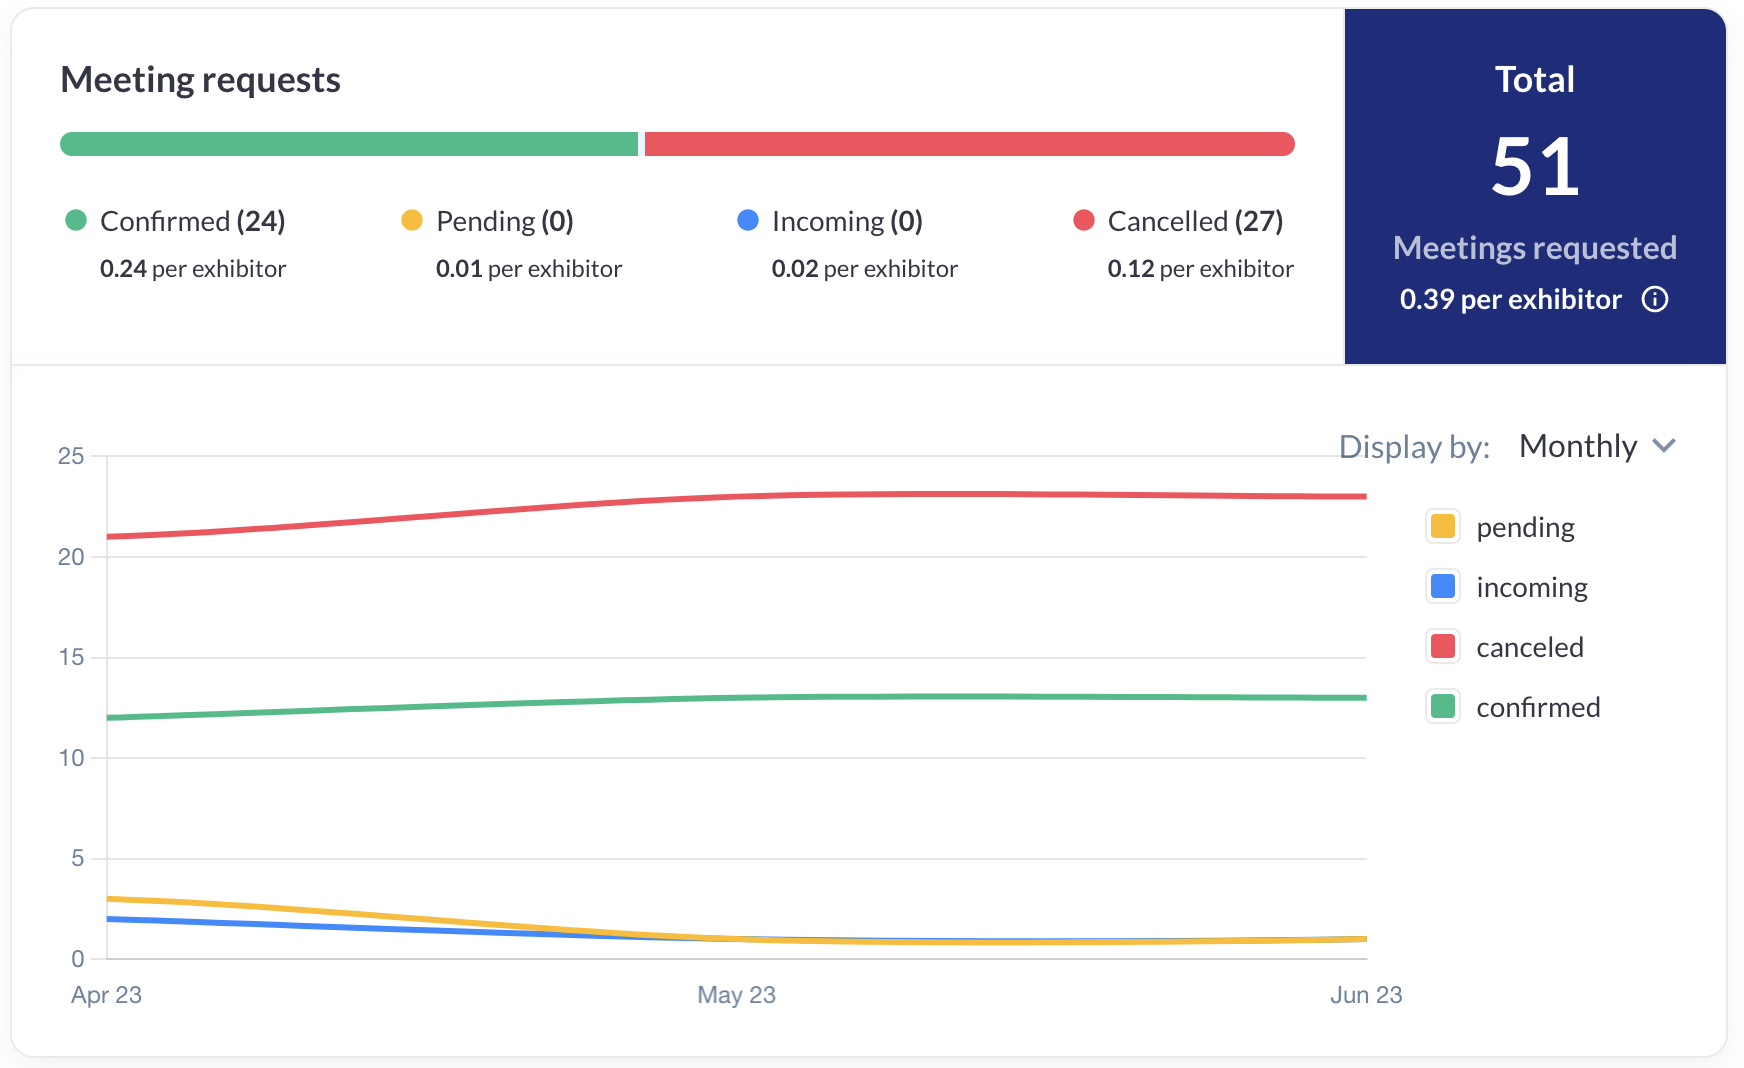
The "Meeting Requests Line Chart" offers a comprehensive view of the meeting requests sent by the exhibitor and their team, featuring advanced analytics and comparative metrics. This total includes both regular and table meetings, providing a holistic view of engagement.
Below are the detailed features and functionalities:
-
Comparison with Event Average:
-
The widget compares the total meeting requests received by the exhibitor to the average number sent by all exhibitors at the event. This comparative analysis helps highlight how the exhibitor stands in relation to others in terms of attracting meeting requests.
-
-
Graphical Time Progression:
-
Features a dynamic graph showing the progression of total meeting requests over time. The data can be displayed by days, weeks, or months, allowing exhibitors to track trends and identify peak periods of engagement.
-
-
Meetings Autoconfirm Setting:
-
When the 'Meetings autoconfirm' setting is enabled, any pending meeting requests are automatically removed from the chart. This setting also removes the yellow indicator from the timeline and the corresponding yellow graph within the chart, streamlining the display to reflect only confirmed meetings.
-
Products Widget
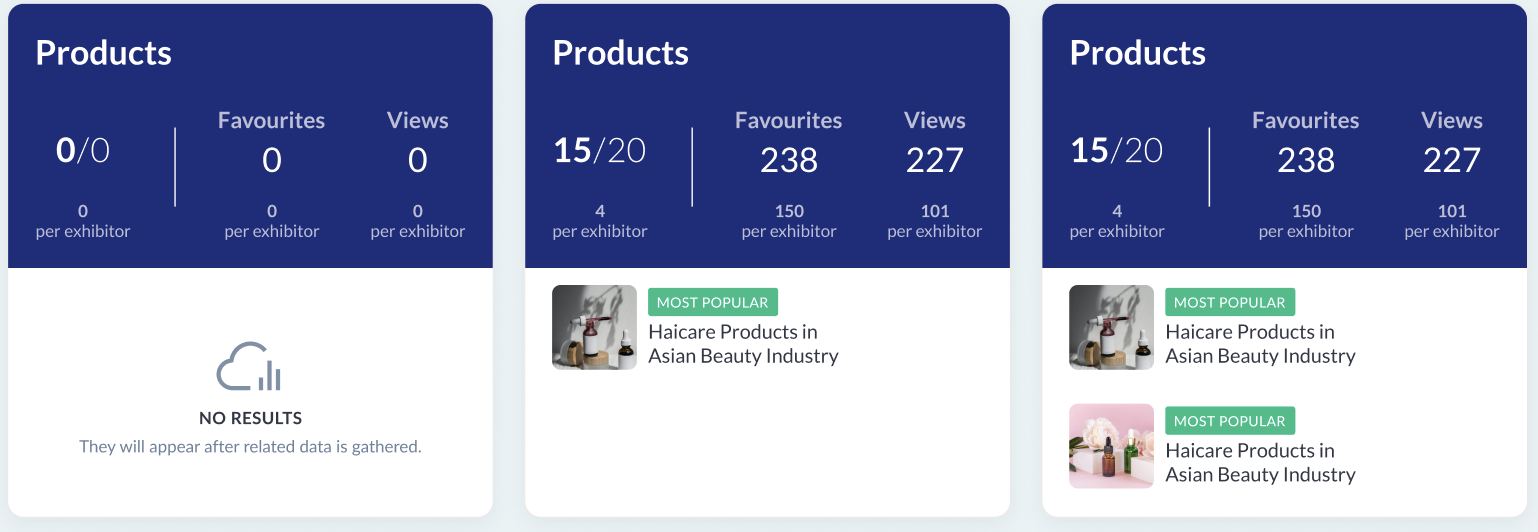
The "Products Widget" provides a detailed analysis of the products listed by an exhibitor on the platform. Here are the detailed features and functionalities of this widget:
-
Product Metrics:
-
Active Products: Displays the number of active products alongside the maximum limit allowed, giving a quick snapshot of product utilization.
-
Favorites and Views: Shows how many times each product has been favorited and viewed. Only unique actions (distinct user interactions) are counted to ensure accuracy.
-
-
Comparison with Event Average:
-
Provides correlated average values for favorites and views per all exhibitors at the event, allowing exhibitors to gauge their performance against a broader event standard.
-
-
Rules for Displaying Most Popular Products:
-
If only one product has favorites, that product is displayed.
-
The two products with the highest number of favorites are always shown, even if the favorite count is significantly different (e.g., 15 vs. 3 favorites).
-
If three products have the same highest number of favorites, the two that achieved this count first are displayed.
-
Among products with a close count but not identical, such as one product significantly higher than two others closely ranked (e.g., 100 favorites vs. 80 favorites each), the product with the highest favorites and the one of the closely ranked pair that reached their count first are displayed.
-
Top Performers Widget
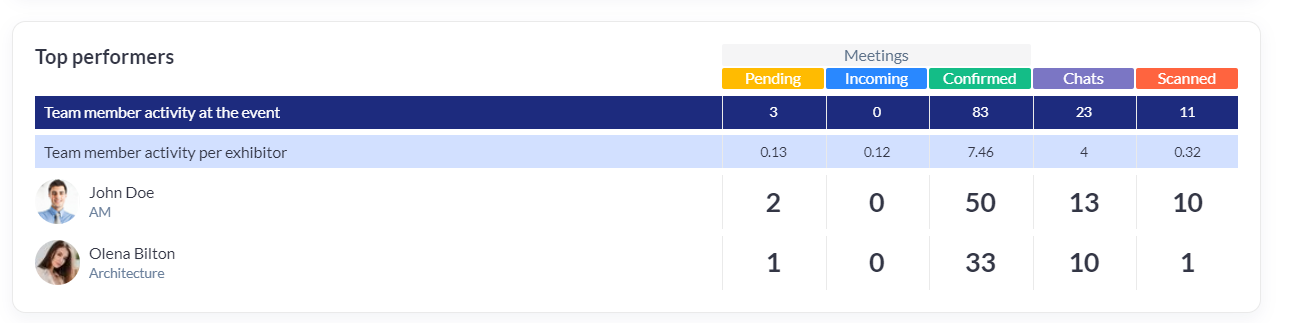
The "Top Performers Widget" showcases the most active team members of an exhibitor, ranking them based on their total interactive engagements at the event. Here’s an overview of its features:
-
Team Member Metrics:
-
Total Interactions: The widget calculates the total interactions done by each team member, including requesting meetings, badge scans, and chats.
-
-
Performance Ranking:
-
Team members are ranked according to the sum of all interactions they’ve completed. The widget automatically places the team member with the highest total at the top, followed by others in descending order of their interaction counts. To maintain clarity and focus, the widget displays a maximum of four top performers.
-
-
Activity Metrics:
-
Team Member Activity at the Event: This metric provides the sum of all actions done by each team member, displayed across designated columns for an organized, at-a-glance view of individual performance.
-
Team Member Activity Per Exhibitor: Similar to the previous metric, but it standardizes the data to an average per exhibitor basis, allowing comparisons across different teams or exhibitions where team sizes may vary.
-
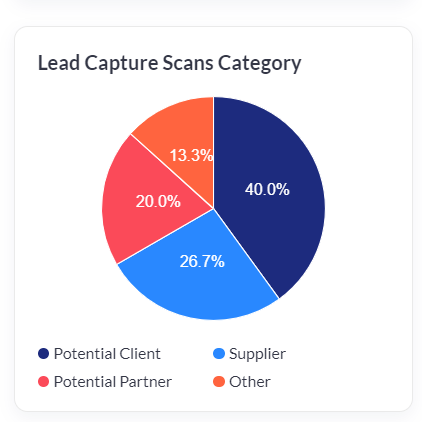
Lead Capture Widget
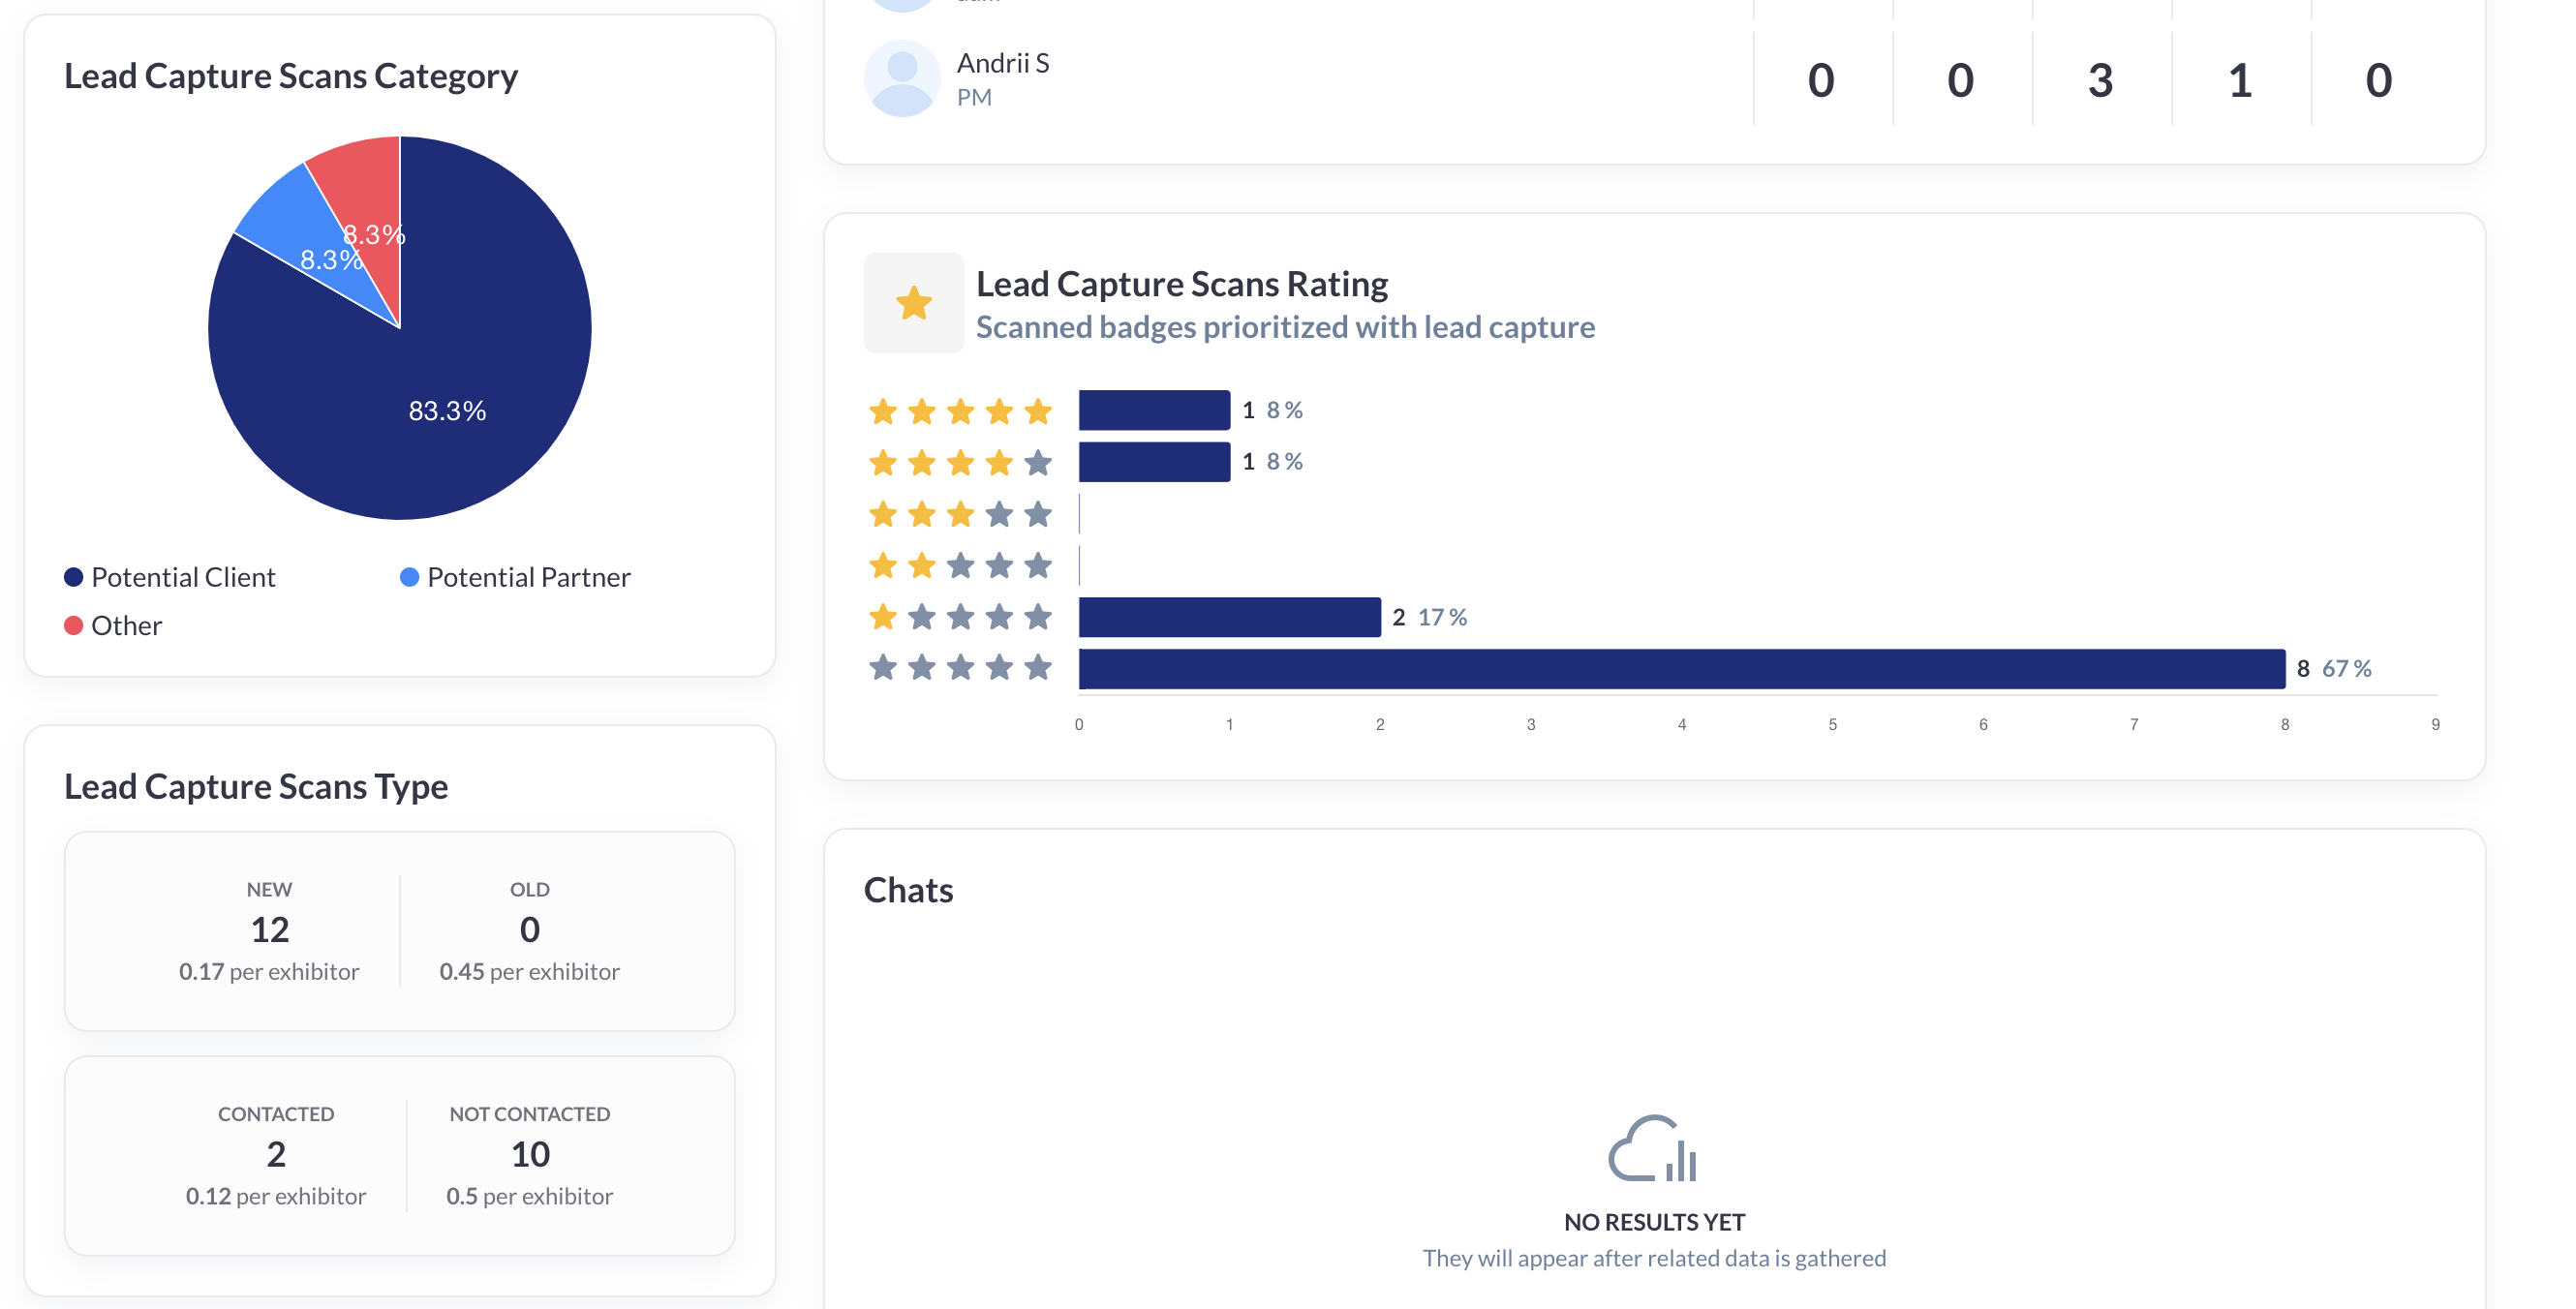
The "Lead Capture Widget" offers in-depth insights into the lead generation activities of an exhibitor by analyzing badge scanning interactions. Here’s an overview of its features:
-
Lead Capture Scans Category:
-
Displays the predefined categories chosen by exhibitors during the lead scanning process. These categories are static within the app and cannot be renamed.
-
-
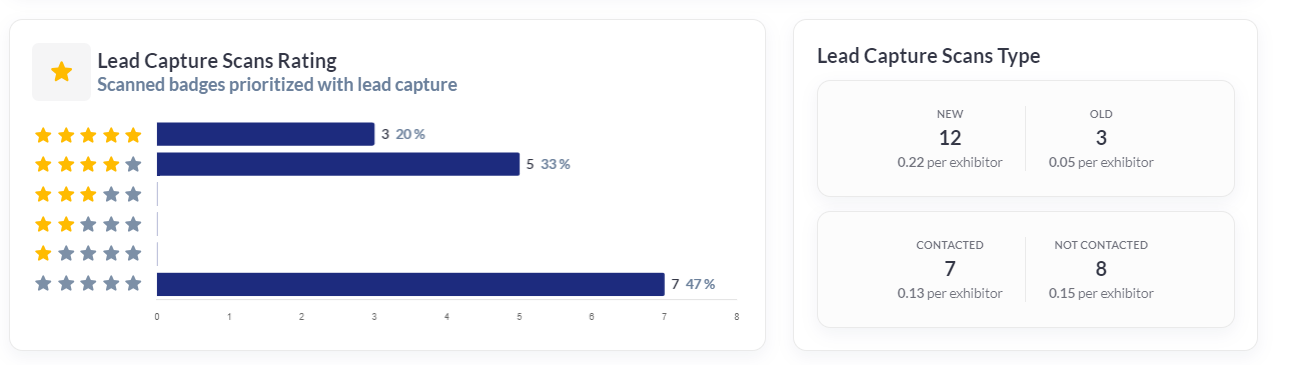
Lead Capture Scans Rating:
-
Exhibitors assign ratings to each scan in the form of stars during the lead capture process. The range is dynamic, adapting based on the largest number of scans received in any category.
-
-
Lead Capture Scans Type:
-
This metric shows the type of scan executed during the lead capture process. Additional qualifiers like whether the scanned lead was new or returning ('New/Old'), and if they were previously contacted ('Contacted'), are filled out by exhibitor during the scan. This section also includes the average values per exhibitor for each type at the event, allowing for benchmark comparisons.
-
-
Conditional Display:
-
The widget is designed with a conditional display feature: if the Lead Capture functionality is disabled for an exhibitor, the entire widget—including all graphs and data representations—automatically disappears from the dashboard.
-
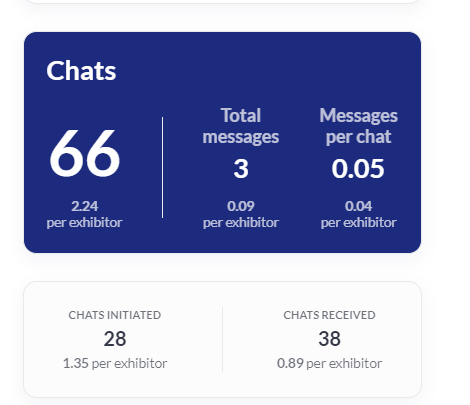
Chats Widget
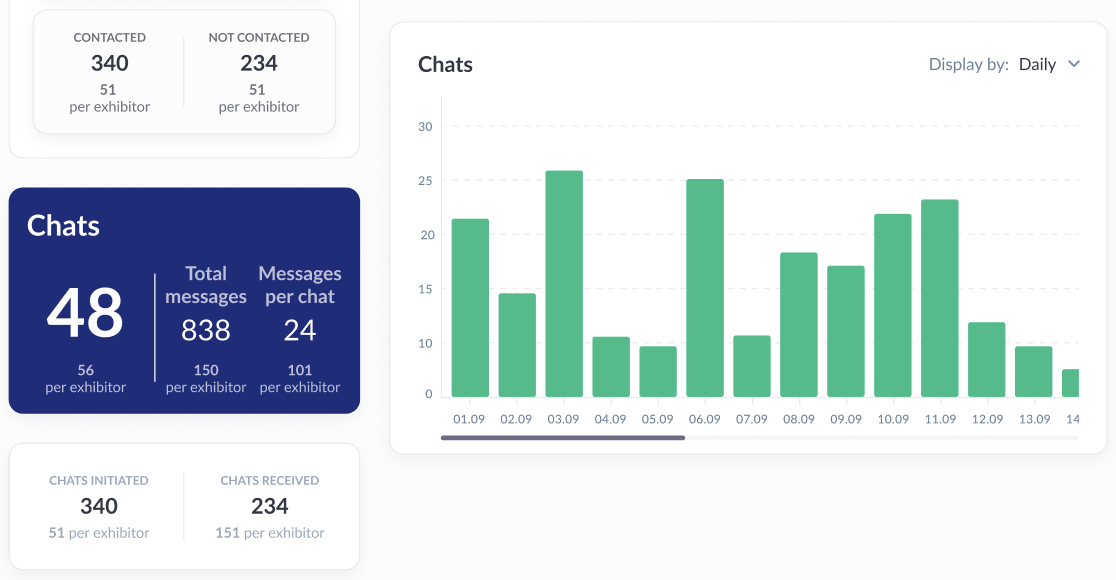
The "Chats Widget" provides exhibitors and event organizers with insightful analytics regarding the chat interactions associated with an exhibitor. Key features include:
-
Chat Metrics:
-
Total Chats: Indicates the total number of chat conversations associated with the exhibitor.
-
Total Messages: Shows the cumulative number of messages sent across all chats.
-
Average Messages per Chat: Calculates the average number of messages sent in each chat by dividing the total messages by the total number of chats.
-
Chats initiated: The number of changes initiated by the exhibitor and its team members.
-
Chats received: The number of chats that were initiated by other exhibitors and participants and included current exhibitor.
-
-
Comparative Analysis:
-
Displays correlated average values for the total chats, total messages, chats initiated, chats received and average messages per chat across all exhibitors at the event, allowing for benchmarking against event-wide metrics.
-
-
Activity Graph:
-
Presents a graph depicting the activity levels in chats over time, highlighting how many chats had messages sent during specific intervals (day, week, or month).
-
A tooltip feature that appears when hovering over the graph bars, revealing the exact number of chats initiated on that specific day, week, or month.
-
-
Graph Dynamics:
-
The widget is designed to adapt the display of bars dynamically. Empty bars at the beginning or end of the date range are excluded from the graph to maintain visual clarity. However, empty bars within the date range are shown to provide a complete timeline of chat activity.
-
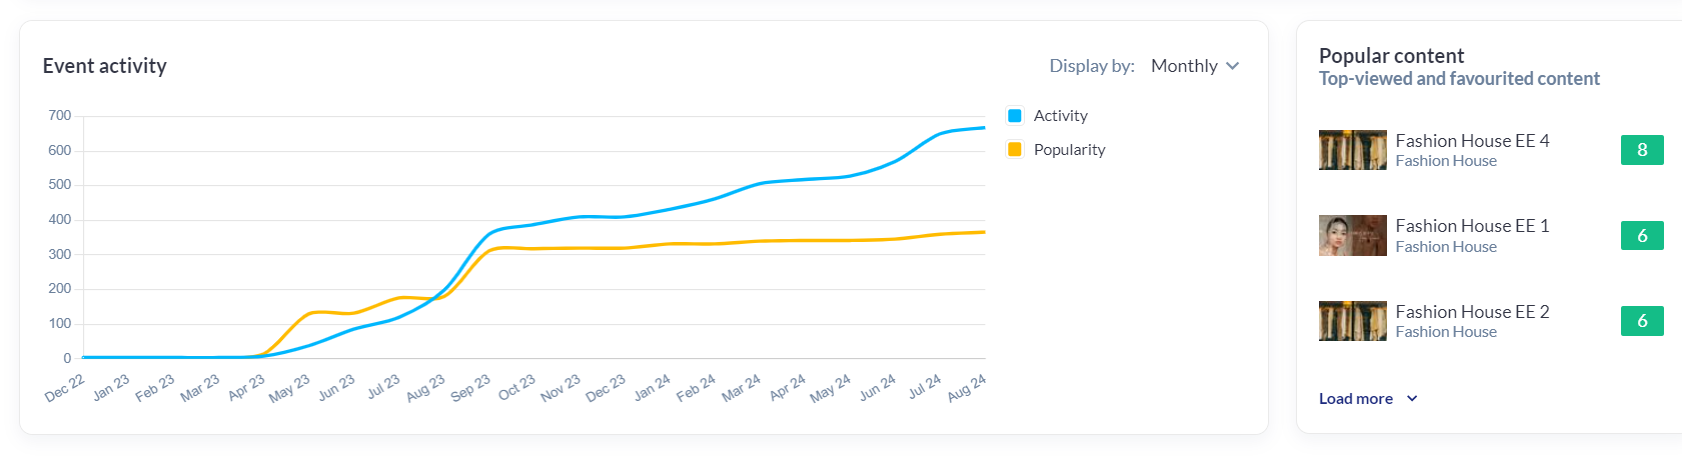
Event Activity Widget
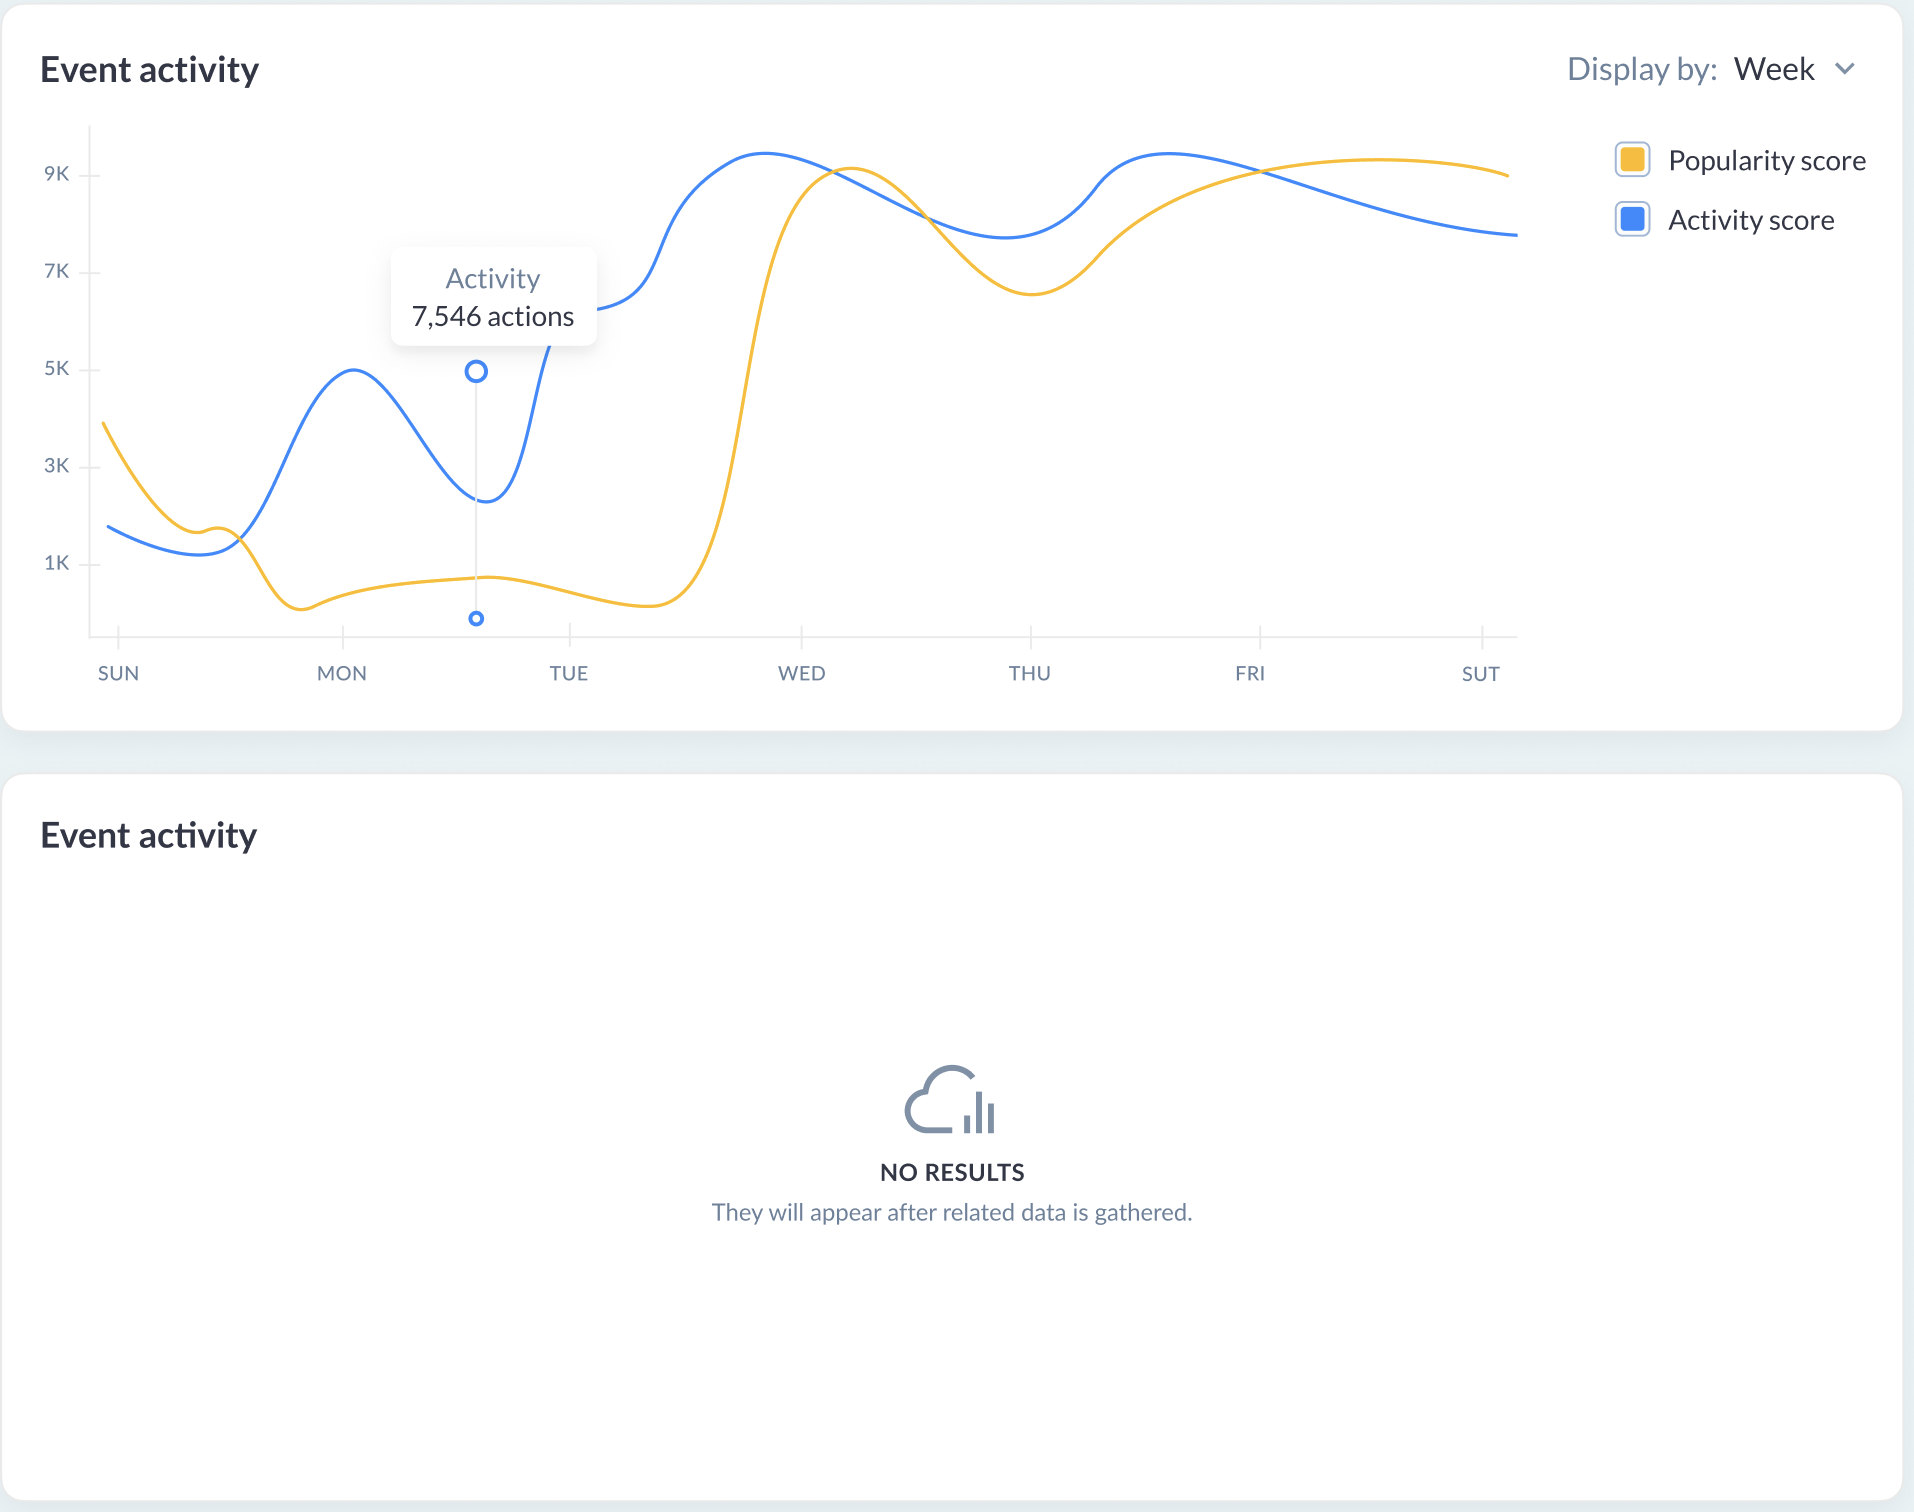
The "Event Activity Widget" offers a visual representation of the activity and popularity scores of an exhibitor, along with their team, as they fluctuate over time. Here’s what the widget includes:
-
Activity and Popularity Scores:
-
Tracks and displays the dynamic changes in both the Activity Score and Popularity Score over specified time periods, offering a granular view of how an exhibitor's engagement levels evolve.
-
-
Graphical Presentation:
-
The scores are plotted over time intervals that can be adjusted to show data by days, weeks, or months, depending on the user's preference for analysis granularity.
-
-
Conditional Display:
-
The widget is only displayed if the "Interaction scores" are set within the event. It will not be shown if:
-
All values in the
admin/interactionscoresfor both Activity and Popularity scores are set to 0, indicating no interaction scoring is being conducted. -
The "Interaction Score" module under the header "Networking & Matchmaking" in module management is turned off, disabling this feature.
-
-
-
Dynamic Scaling:
-
The range displayed on the left side of the graph is dynamic, adjusting according to the maximum interaction score value recorded, ensuring the graph is always optimally scaled for the best visual representation.
-
-
Interactive Elements:
-
Hovering the mouse cursor over any specific point on the graph reveals a tooltip that shows the exhibitor’s score at that moment, providing immediate and precise feedback on performance at any given point in time.
-
Popular Content Widget
The "Popular Content Widget" offers an in-depth look at the content offerings of an exhibitor that have garnered significant attention, such as news articles, event bookings, or downloadable materials. Here are the specifics of its features:
-
Content Categories:
-
Exhibitor News: Tracks and displays news items related to the exhibitor based on the number of views.
-
Exhibitor Events: Shows events associated with the exhibitor, ranked by the number of bookings.
-
Downloaded Content: Lists content that has been downloaded by participants, ranked by download count.
-
-
Display Mechanics:
-
Initially, the widget displays only the three most popular items in each category. This is designed to provide a snapshot of the highest-performing content at a glance.
-
-
Expansion Feature:
-
A "Show more" button allows users to reveal three additional items at a time. This button remains available and functional as long as there are more items to display, facilitating deep dives into the content popularity hierarchy.
-
-
Integration and Reference:
-
The widget builds upon similar statistics available at
admin/stat/general#content, enhancing the detail and focus specifically on the exhibitor’s content.
-
Troubleshooting:
Question:
Is there a graph under the Exhibitor Analytics that could show the lead capture scans per type of lead category when an exhibitor team member scans a badge onsite?
Answer:
Yes, there is a pie chart under Exhibitor Analytics showing the breakdown as shown below.
Question:
Can I track the number of leads not contacted so far under Exhibitor Analytics?
Answer:
Yes, we have a breakdown as shown below.
Question:
Can I track the unique leads as part of the lead capture functionality under the Exhibitor Analytics?
Answer:
Yes, we have the total unique actions and the breakdown per action type.
Question:
Can I track the number of weekly meeting requests under the Exhibitor Analytics?
Answer:
Yes, we can filter by Day, week or month.
Question:
Can the exhibitor analytics show the number of chats initiated Vs. received numbers for an exhibitor?
Answer:
Yes, the ‘Chats' widget shows this data.
Question:
Can I preview the Exhibitor Interactions dashboard without logging in to their profile on the front end?
Answer:
Yes, the Exhibitor Analytics under each exhibitor profile on the back end under Management >>> Exhibitors >>> Analytics shows the Leads Dashboard as shown in the example below:
Question:
Can we track the Activity and Popularity scores for an exhibitor on a daily basis under the Exhibitor Analytics? Also, is there a way to track the most popular exhibitor events?
Answer:
Yes, we have the ‘Events Activity’ and ‘Popular content’ widgets showing this information as shown in the example below.