Available Analytics:
Overview Page
-
Overview: This page provides analytics related to event check-ins and check-outs. It adjusts the scaling of bars based on their count, similar to a previously implemented task.
-
Time Zone: Times are adjusted according to the event's time zone.
-
User Registration: Includes internal and external registrations.
-
Filters:
-
Users and Zones: Filters operate like those on the admin/stat/general#appdata page, including a "Select all" option.
-
User Role and Category: Filters include multi-select capabilities.
-
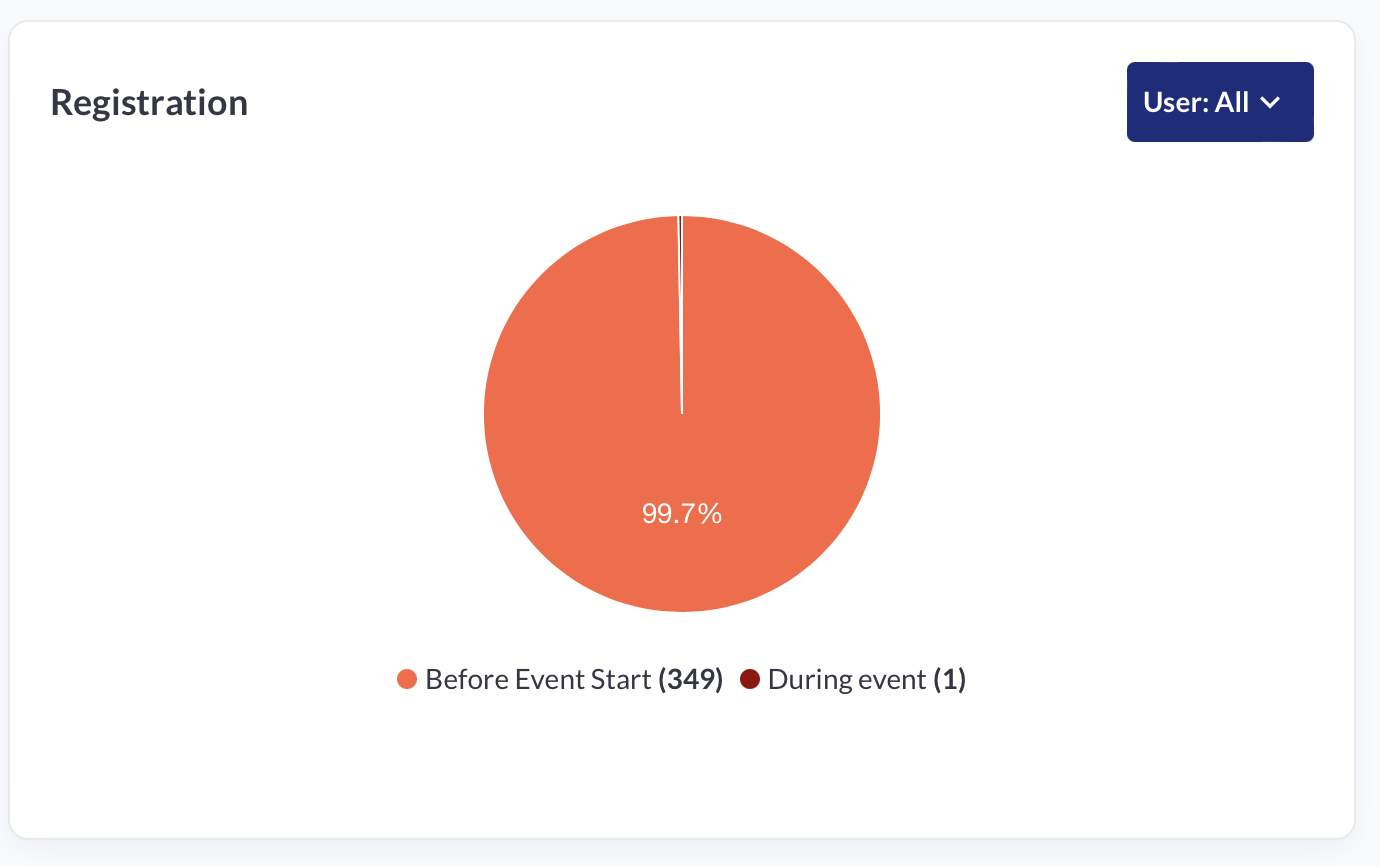
Registration Analytics:
-
Pie Chart: Displays total registrations split by before and after the event start, defined by the 'Date (from)' field in admin/general/edit. Hovering over the chart segments reveals the number of registrations.
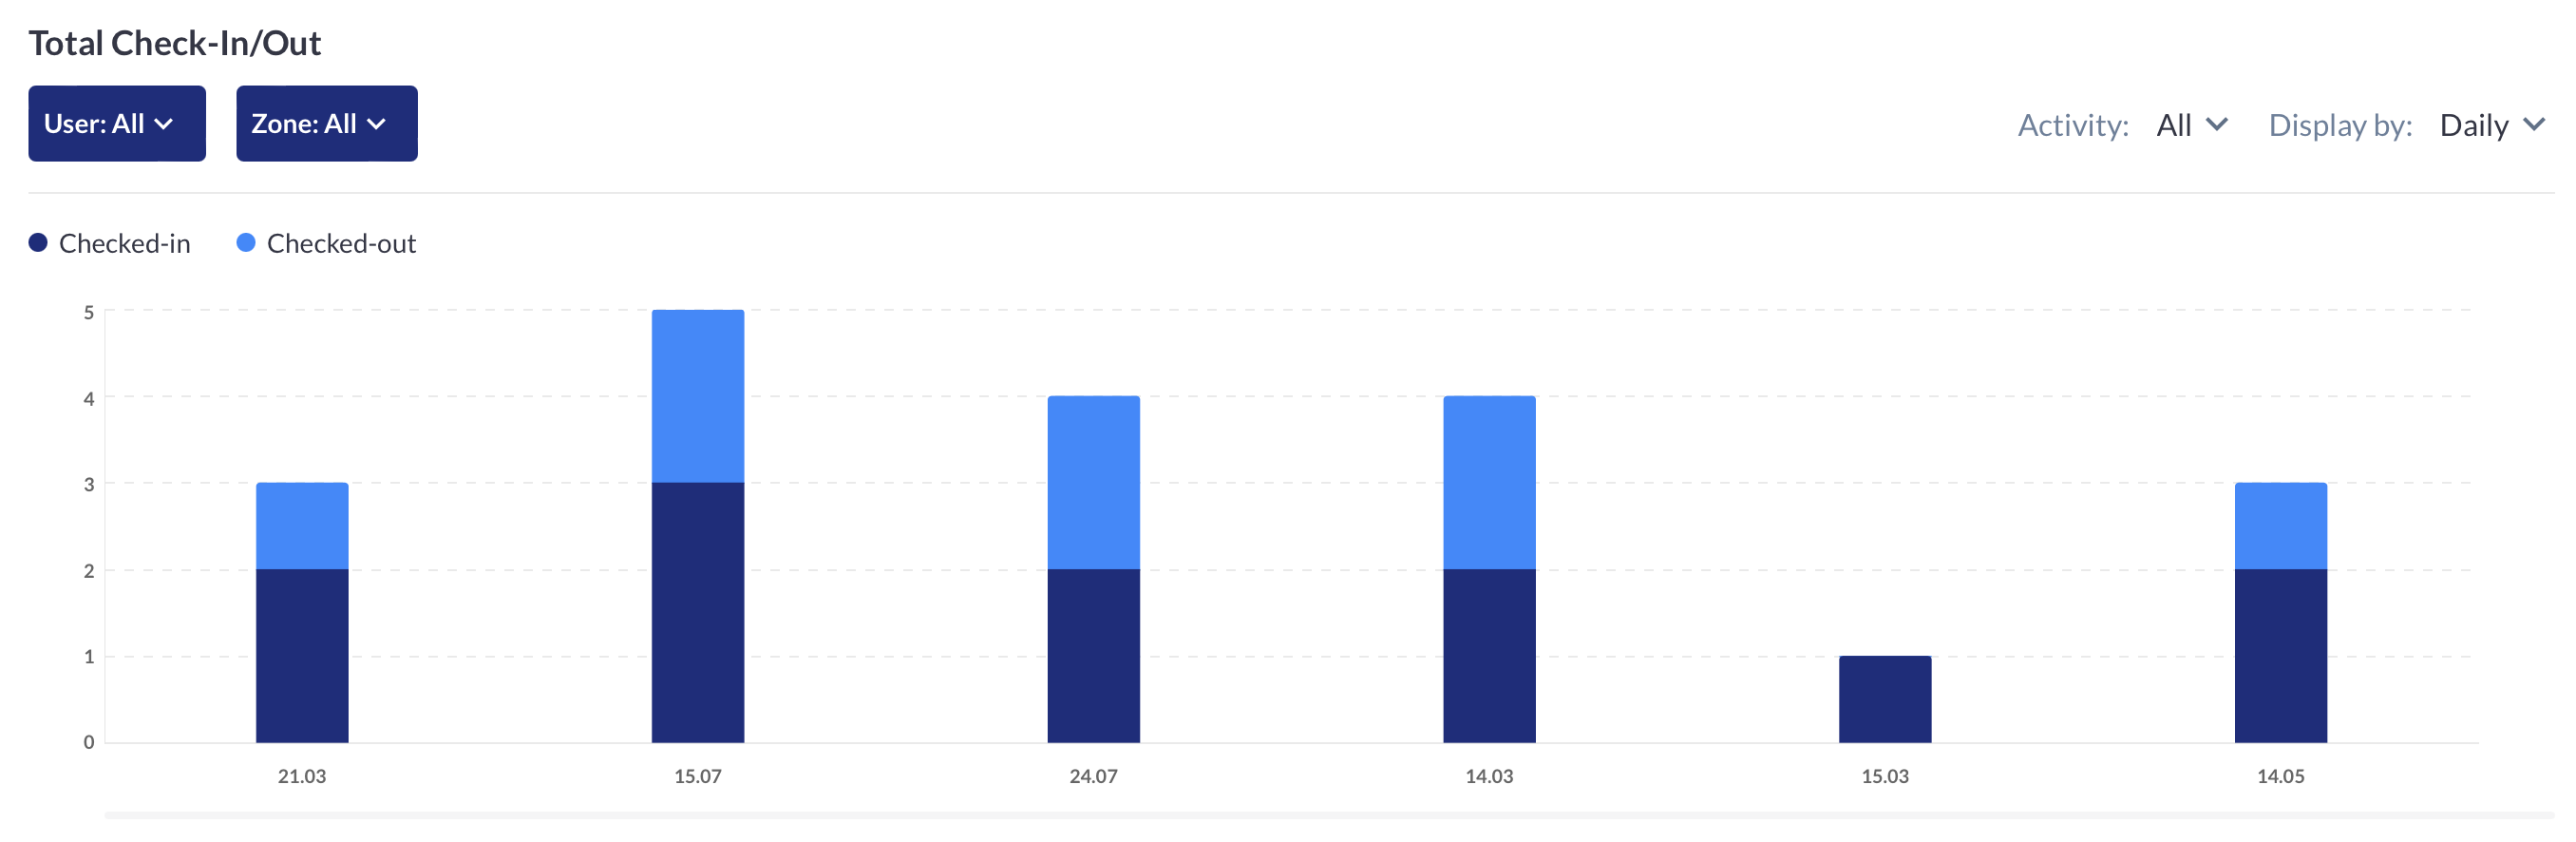
Total Check-ins/Outs:
-
Display: Shows daily or hourly check-ins/outs. Only active times are displayed, discarding empty days. Bars cover the time from the first to the last action within the specified range, showing empty hours as zero values in tooltips.
-
Filters: Includes user role, category, zone (from the floor plan), and action type (all, in, or out). The display switches between daily and hourly views, with the ability to select specific days.
-
Zone Filter: Allows selection of specific check-in zones, with a counter indicating additional selected zones.
-
-
Y-Axis and Bar Width:
-
Y-Axis: Dynamically adjusts to the maximum number of check-ins, based on an existing platform example.
-
Bar Width: Maintains consistency with the design, with a scroll for navigation if numerous bars are displayed.
-
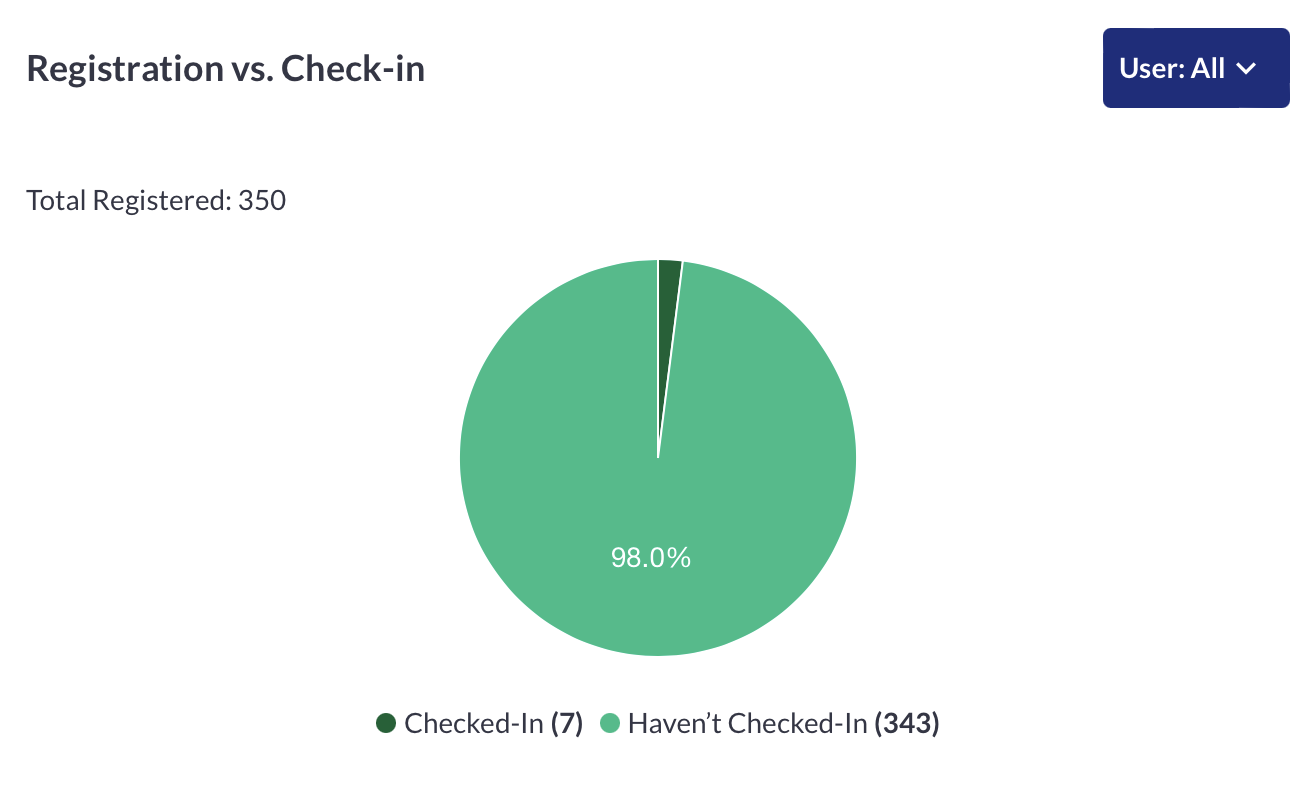
Registration vs Check-in Analytics
-
Pie Chart: Displays total event registrations divided into those who checked in at least once and those who did not.
-
User Filter: Operates similarly to other user filters on the page, applicable to all user roles.
-
Tooltip: Shows the total number of registered participants, including all roles like speakers, team members, etc.
-
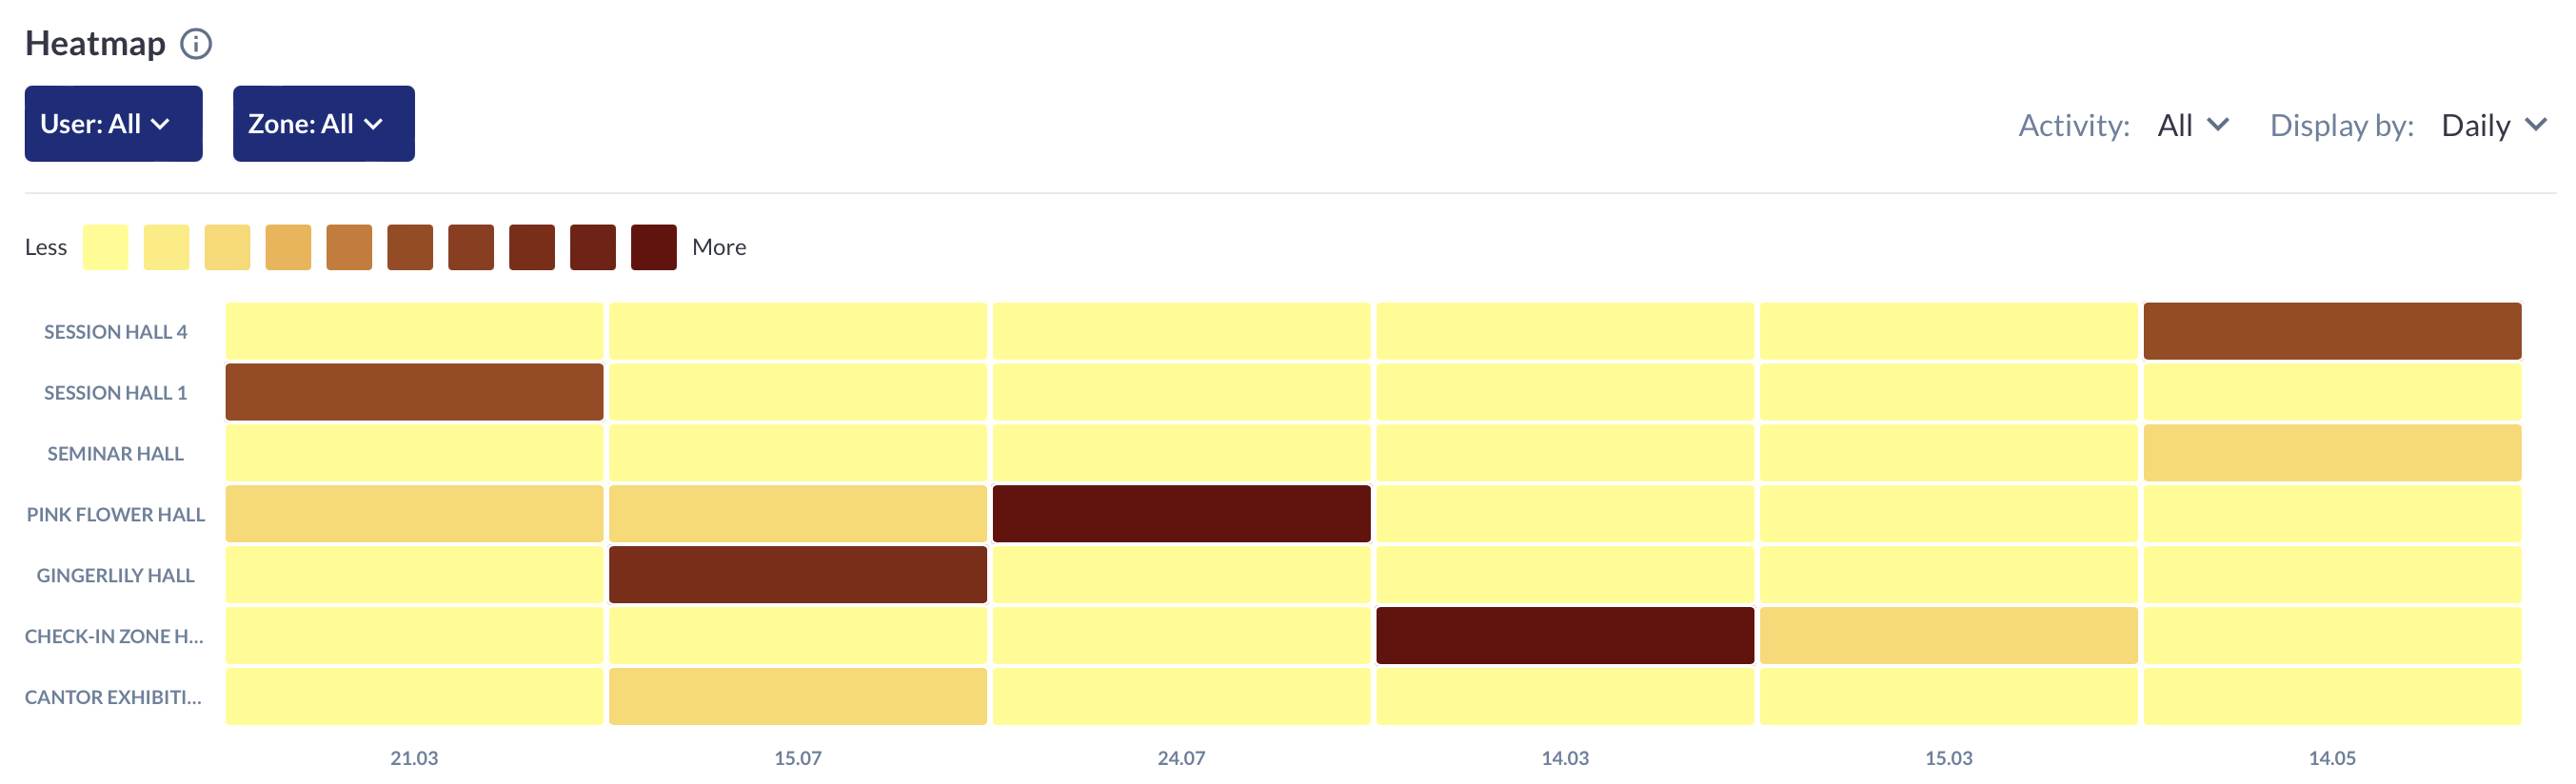
Heatmap of Check-ins:
-
Visualization: Features a 10-color gradient from lighter to darker, representing check-in frequency from 0% to 100% in 10% increments. The darkest color represents the maximum value for the selected filters. This rule works for the whole graph and not just for some of its parts.
-
Tooltip: Displays the total check-ins, check-outs, and combined totals for each zone, along with the full date and time. The tooltip omits the time when data is displayed by day.
-
Zone Identification: Hovering over the zone name reveals its full designation.
-
Filter Functionality: Identical to the filters used in the Total Check-ins graph.
-
Heatmap Tooltip: Clarifies that shading is proportional to the maximum check-in value, considered as 100%.
-
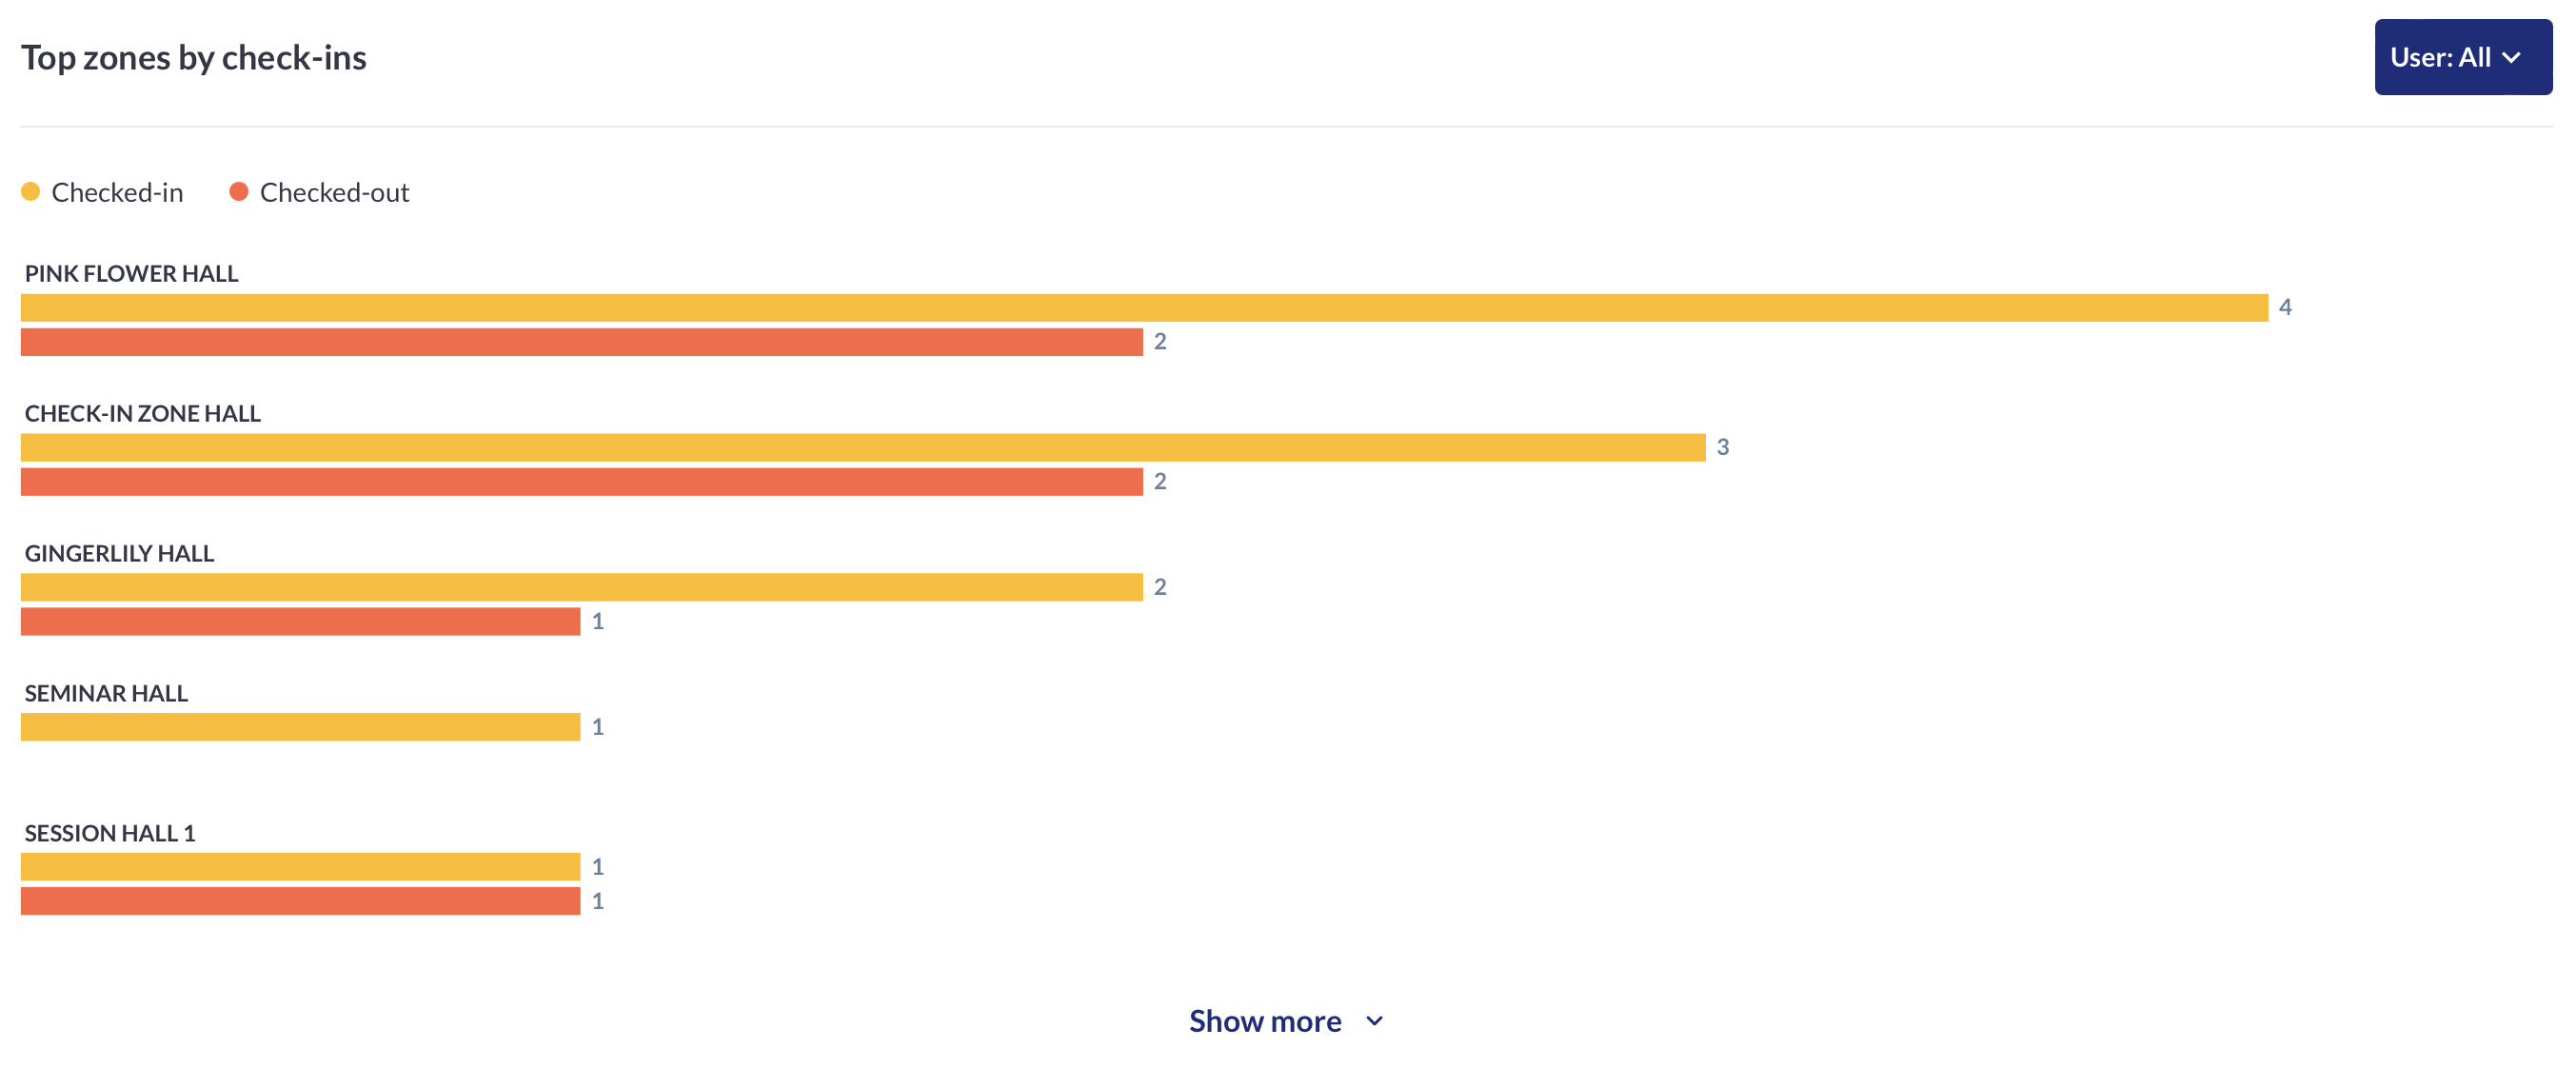
Total Check-ins/outs by Zone (Top Zones):
-
Display: Shows top check-in zones, ranking up to the top 5, with additional zones loadable in increments of 5.
-
Tooltip: Emphasizes that rankings are based on check-ins, with check-outs provided for informational purposes only.
-
Navigation: Includes a scroll feature for viewing more zones.
-
Adaptation
-
Graph Layout: The heatmap graph is designed to occupy no more than 90% of the screen height. The header, including filters and the color legend, remains fixed, while the zone information scrolls within the graph.